


OEE
increase
✔️ shorter downtimes
✔️ faster production launch
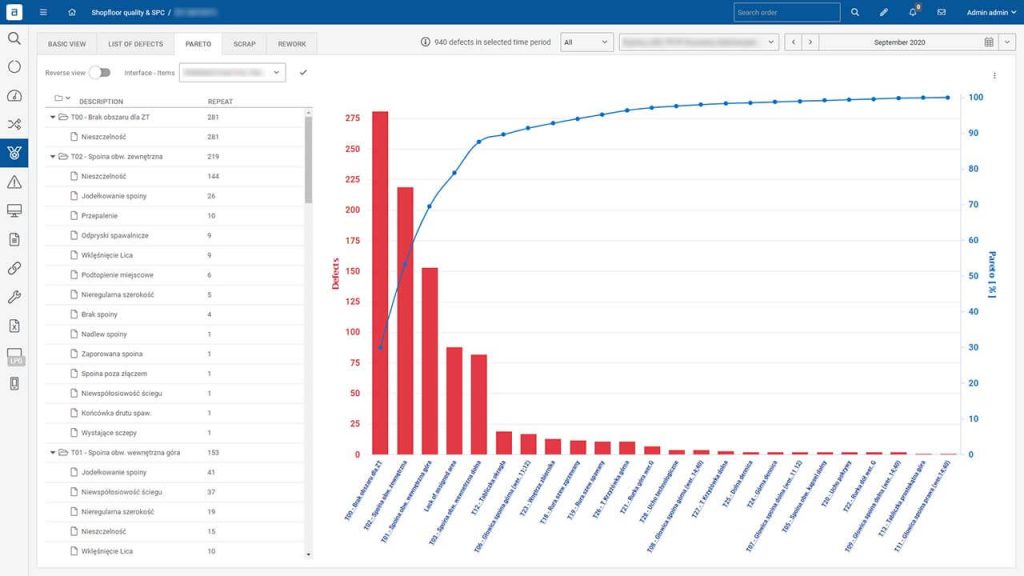
✔️ pareto defects analysis

Faster and reliable
data-driven decisions
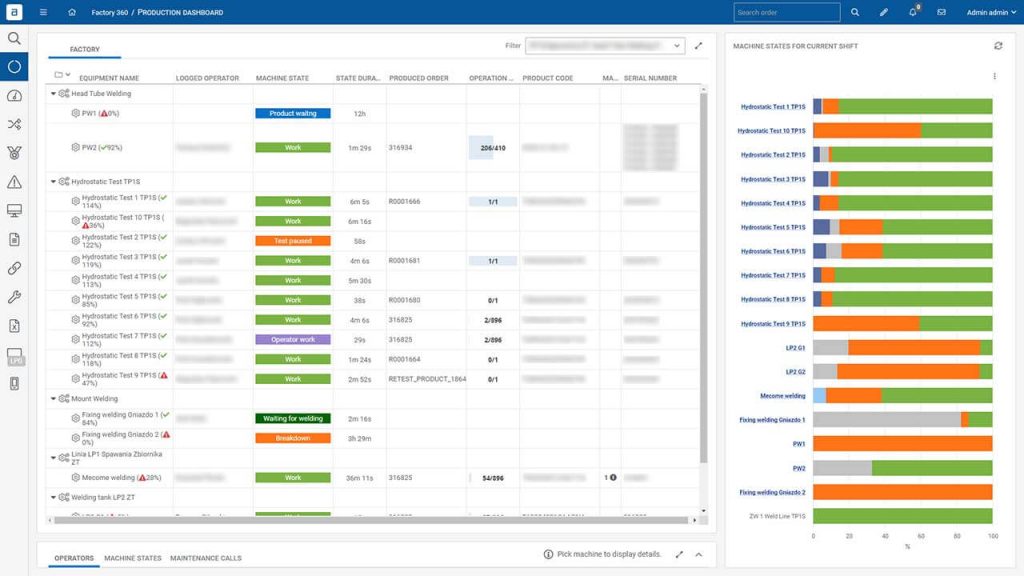
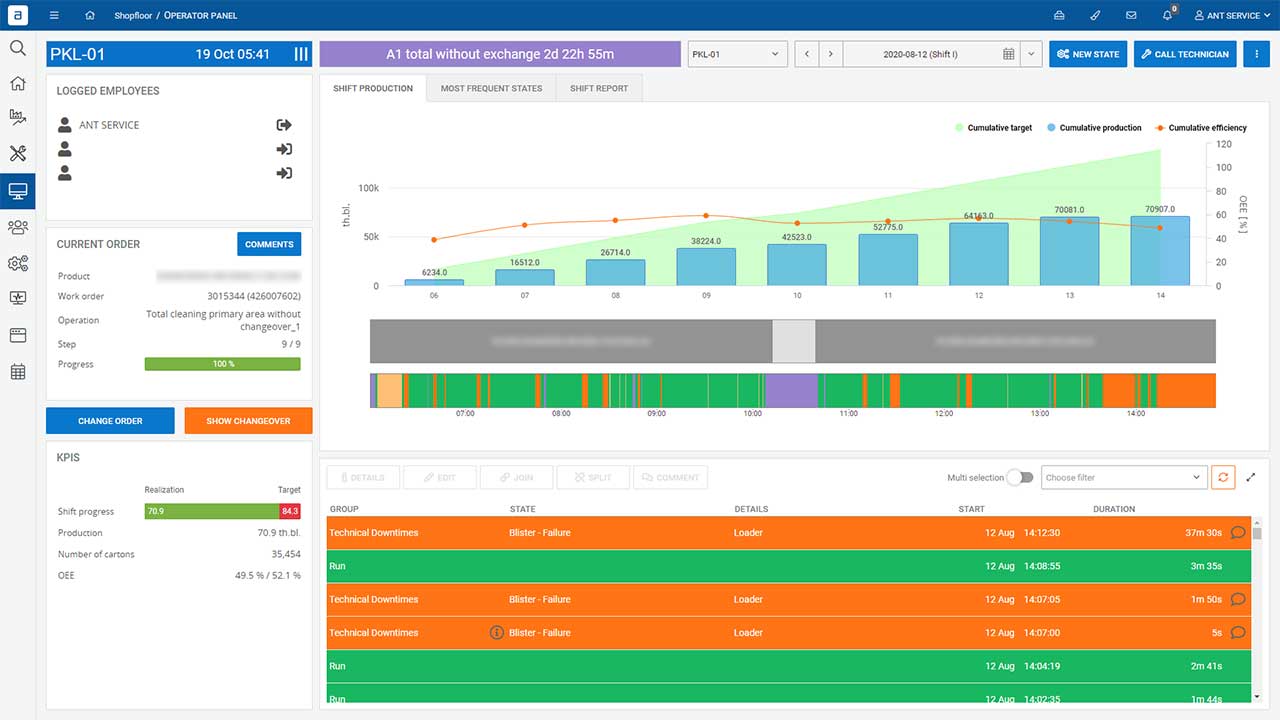
✔️ signals taken from machines
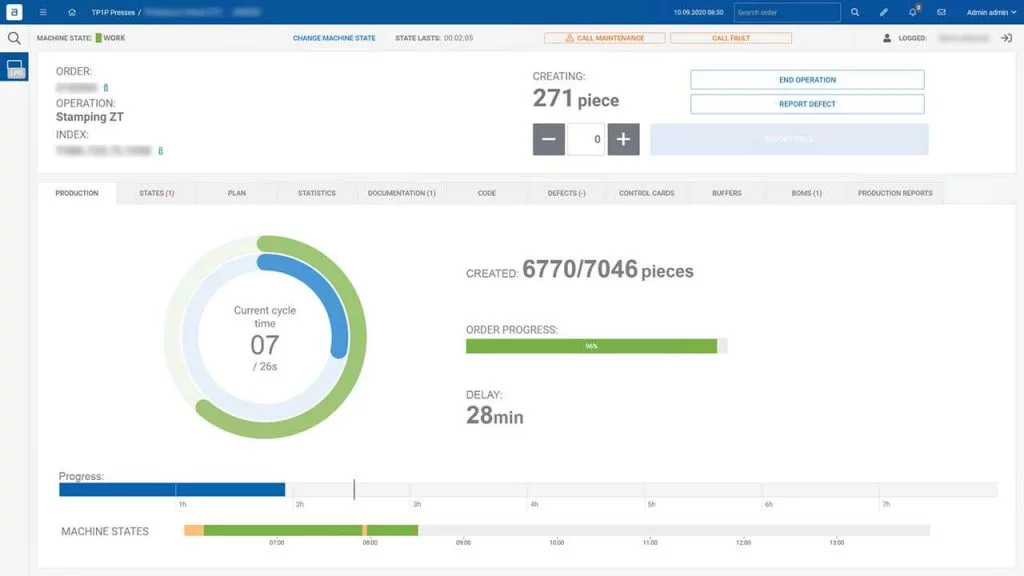
✔️ showing real production progress
✔️ automated notifications

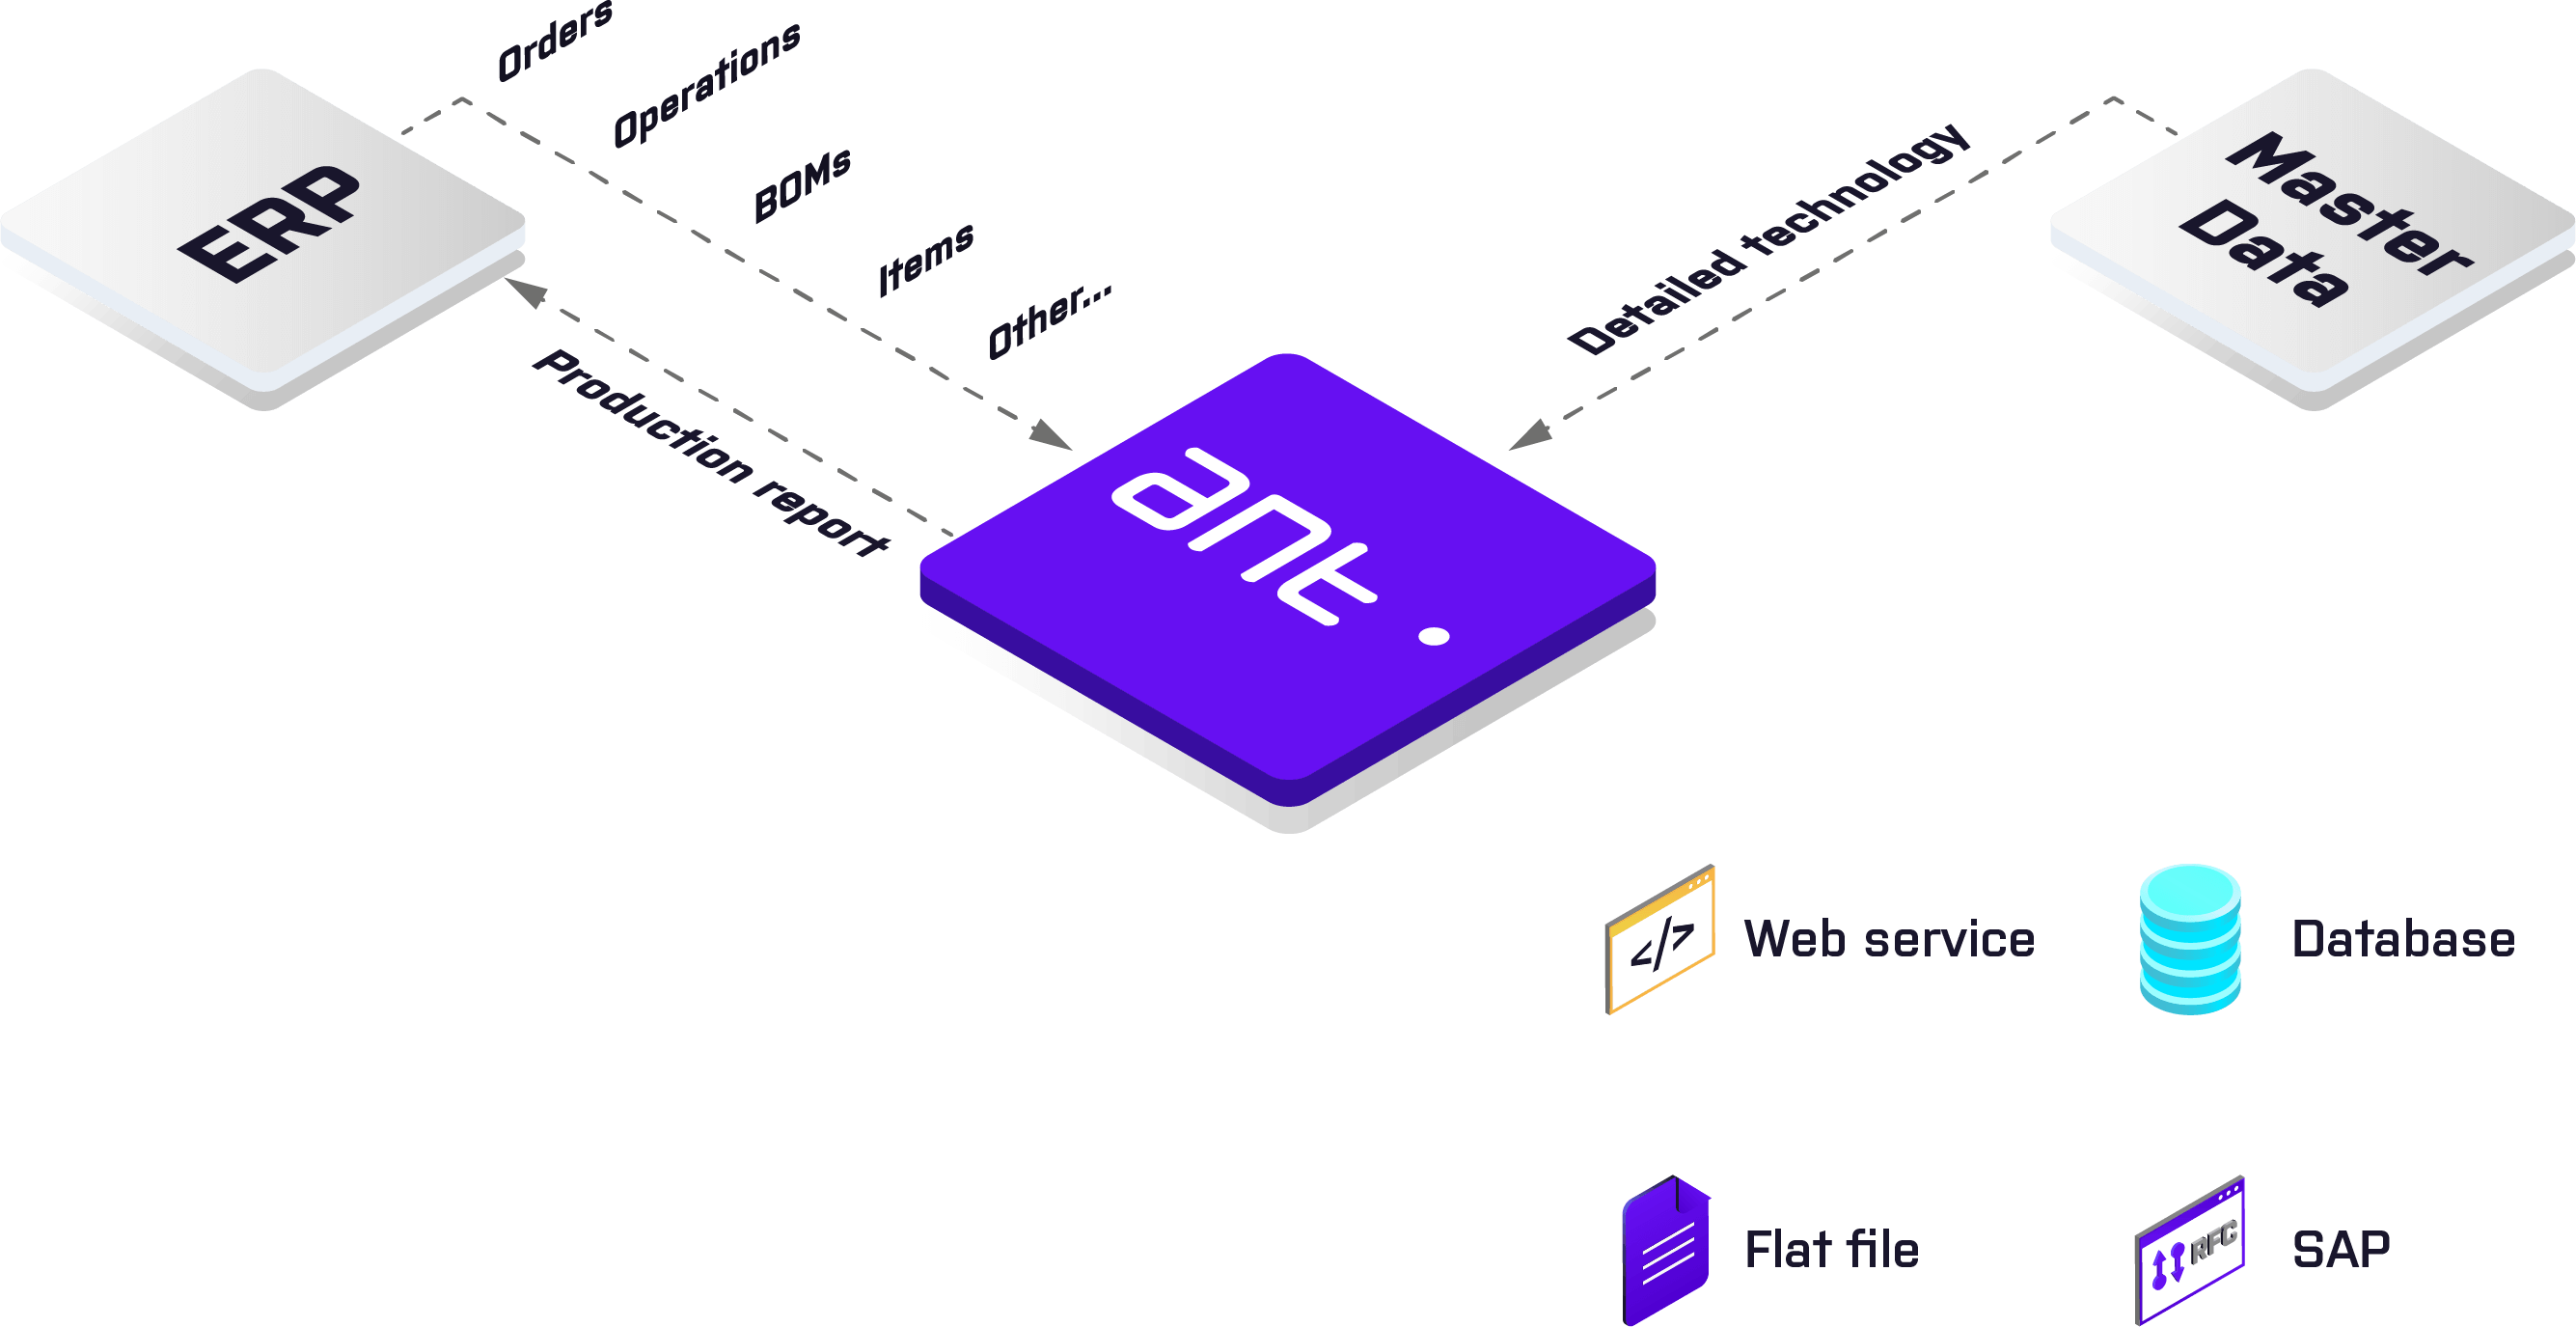
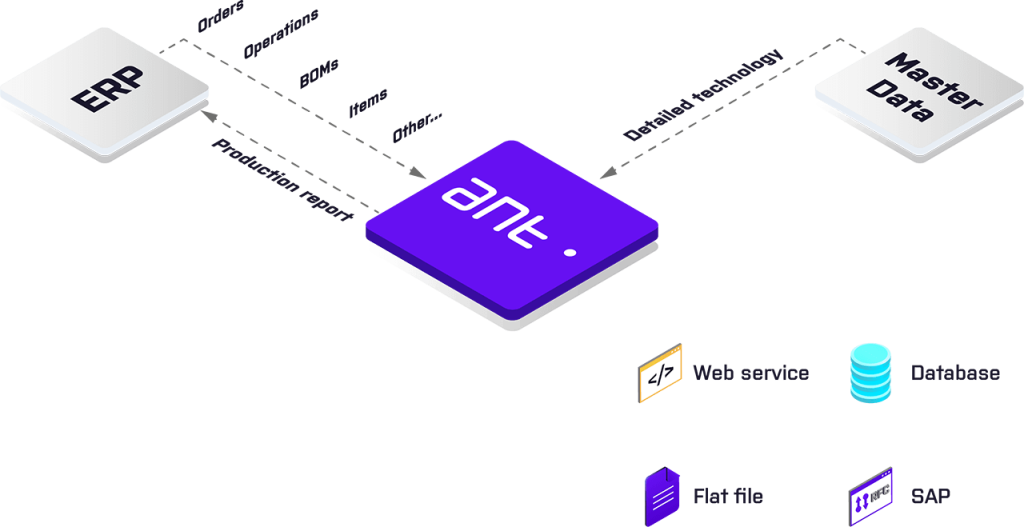
Elimination of double and manual reporting
✔️ automated production reports
✔️ any ERP integration
✔️ machine states from PLCs
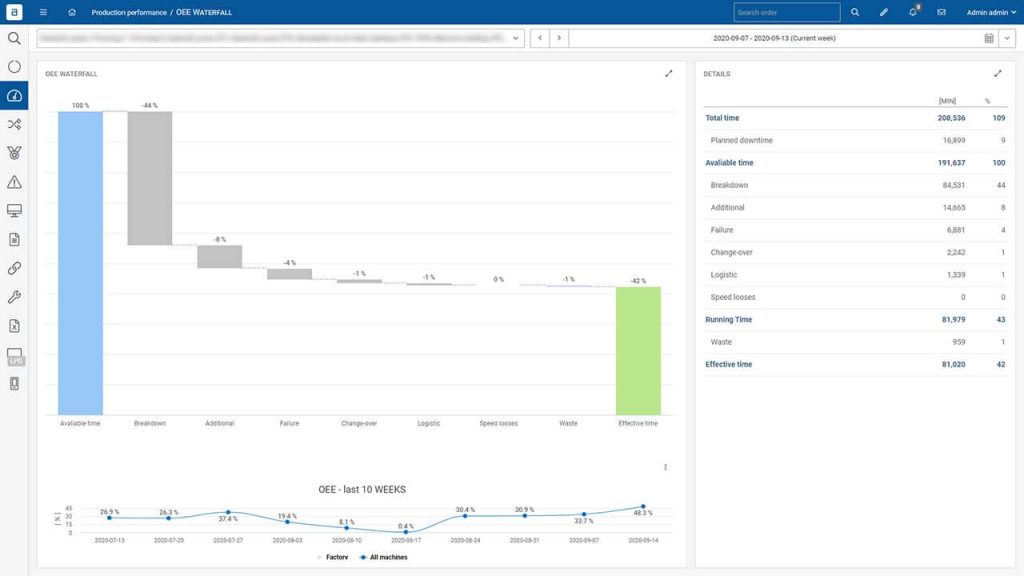

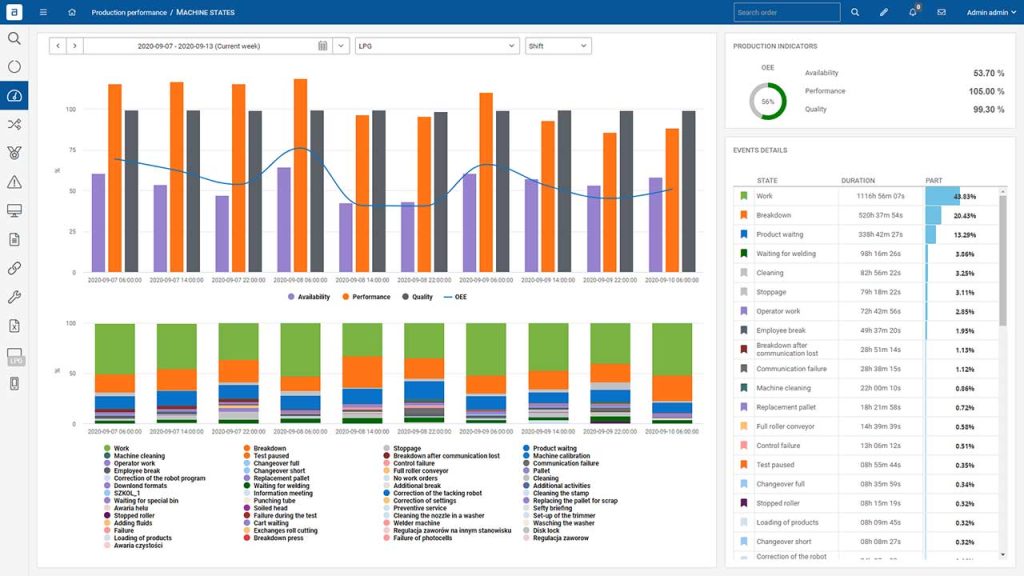


Why does OEE drop after MES implementation?
After the implementation of MES, we usually notice a strange effect. In most cases, after the system go-live, the OEE coefficient is lower than before the installation.
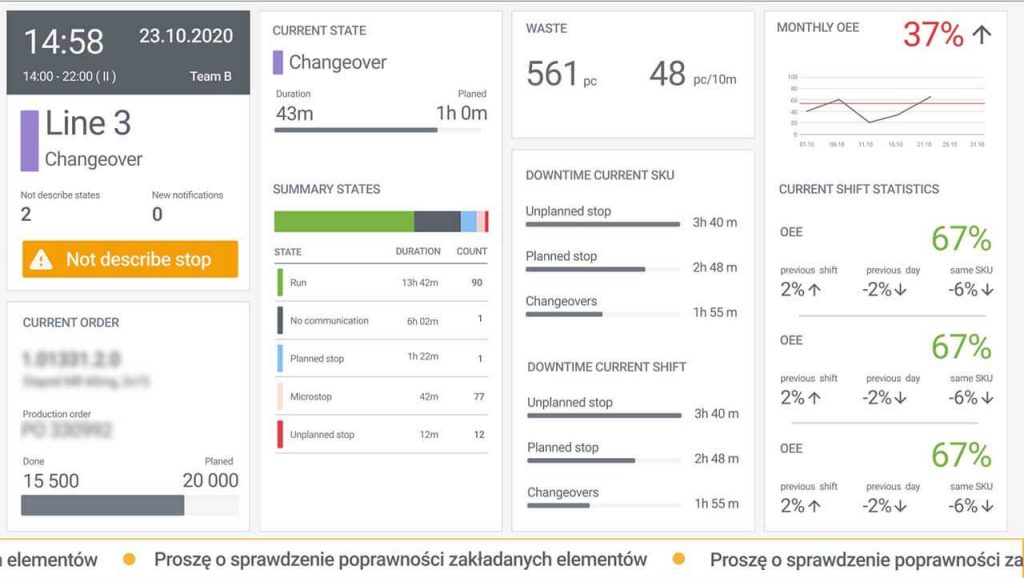
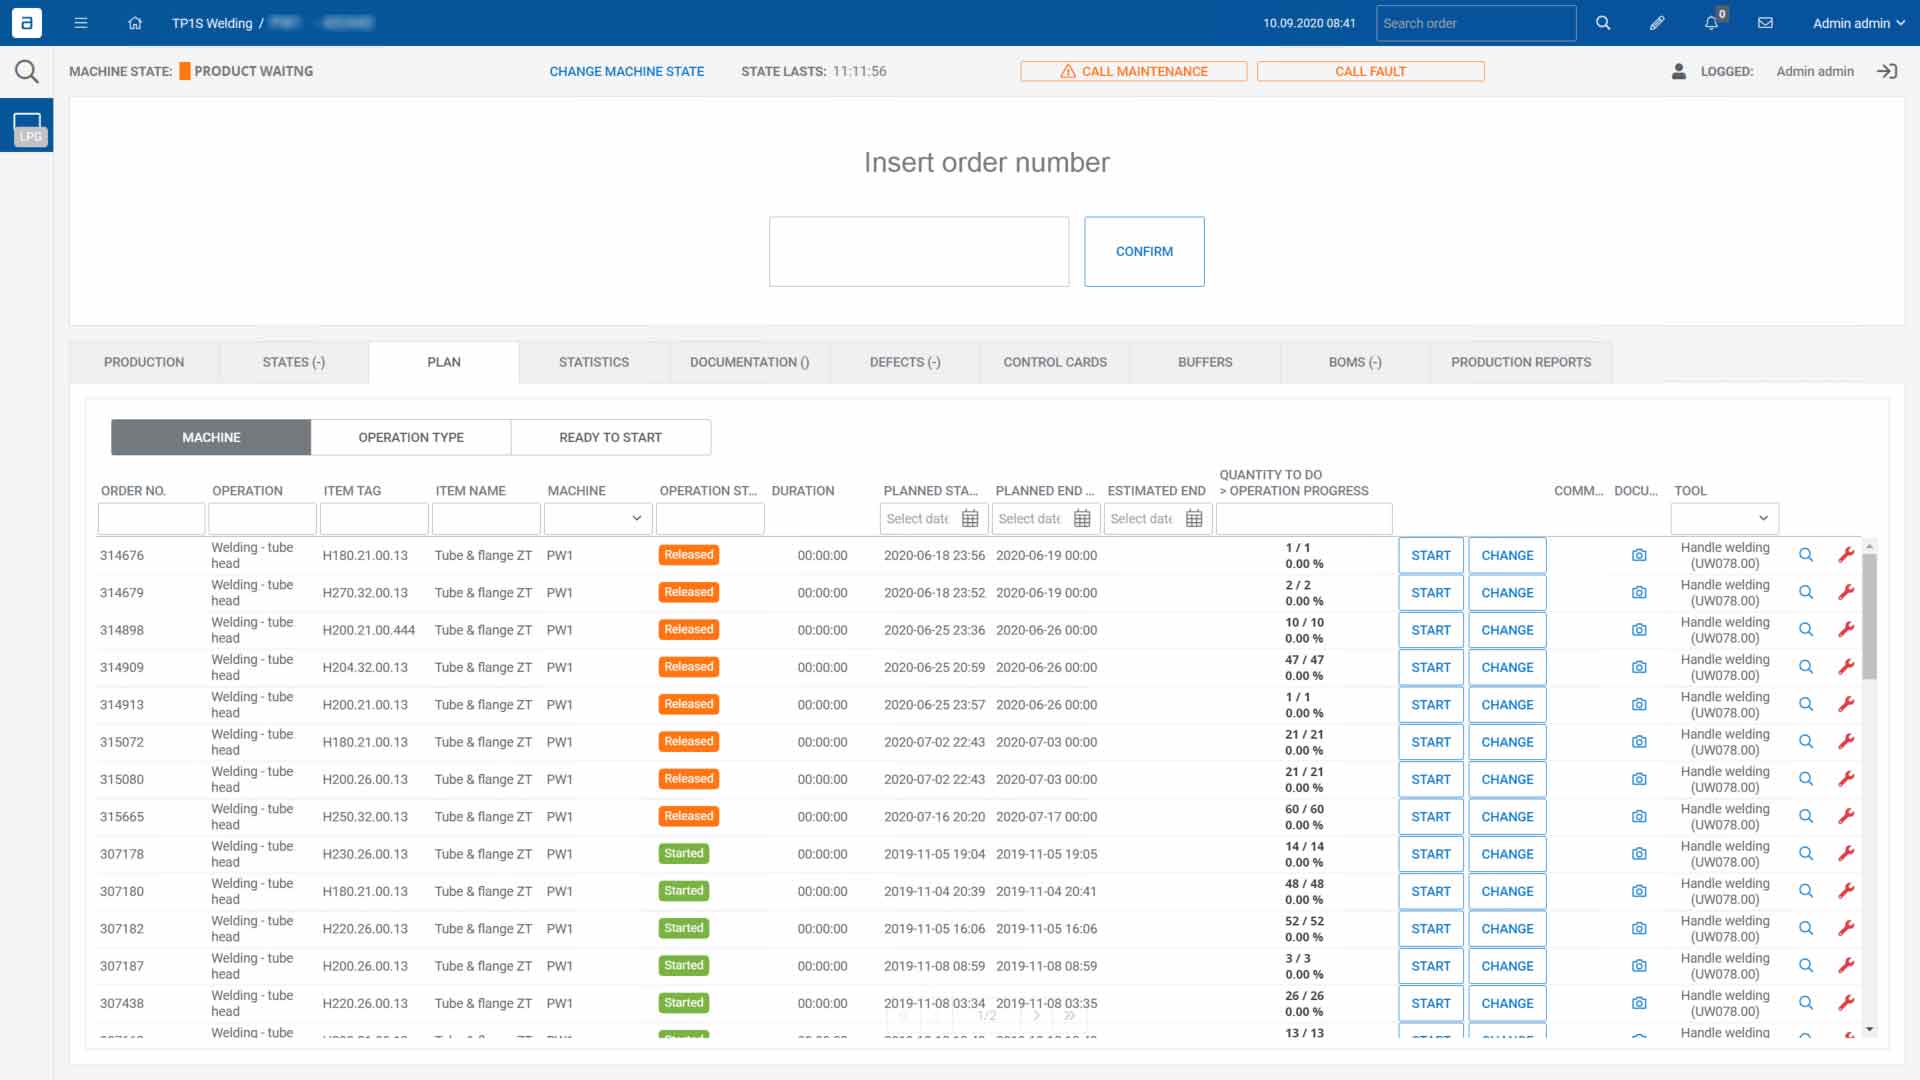
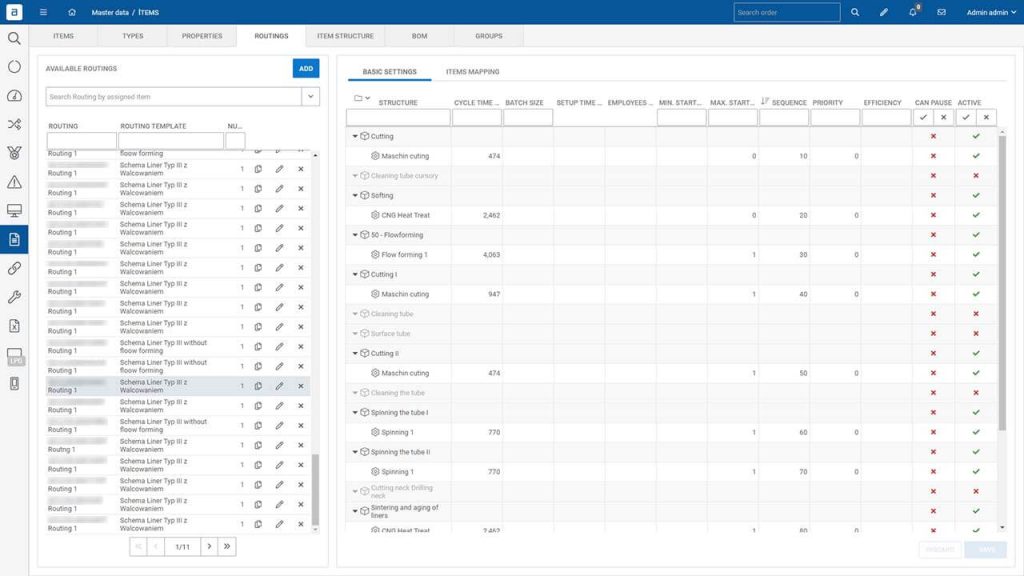
How to increase production transparency on the factory shopfloor?
Transparency in manufacturing may sound like a marketing ploy, but it actually brings tangible benefits, from smoother workflows to significant financial savings. If transparency in
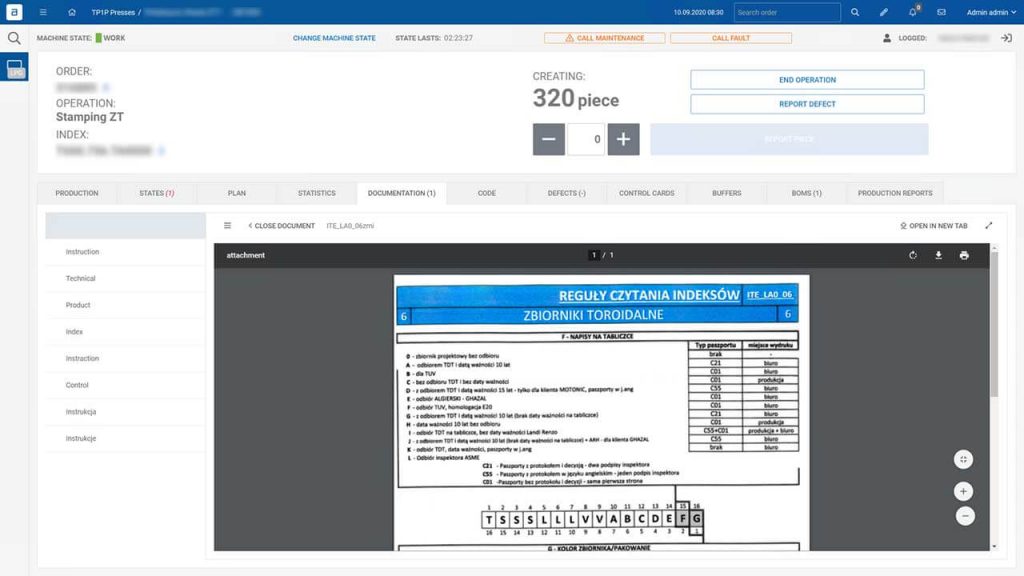
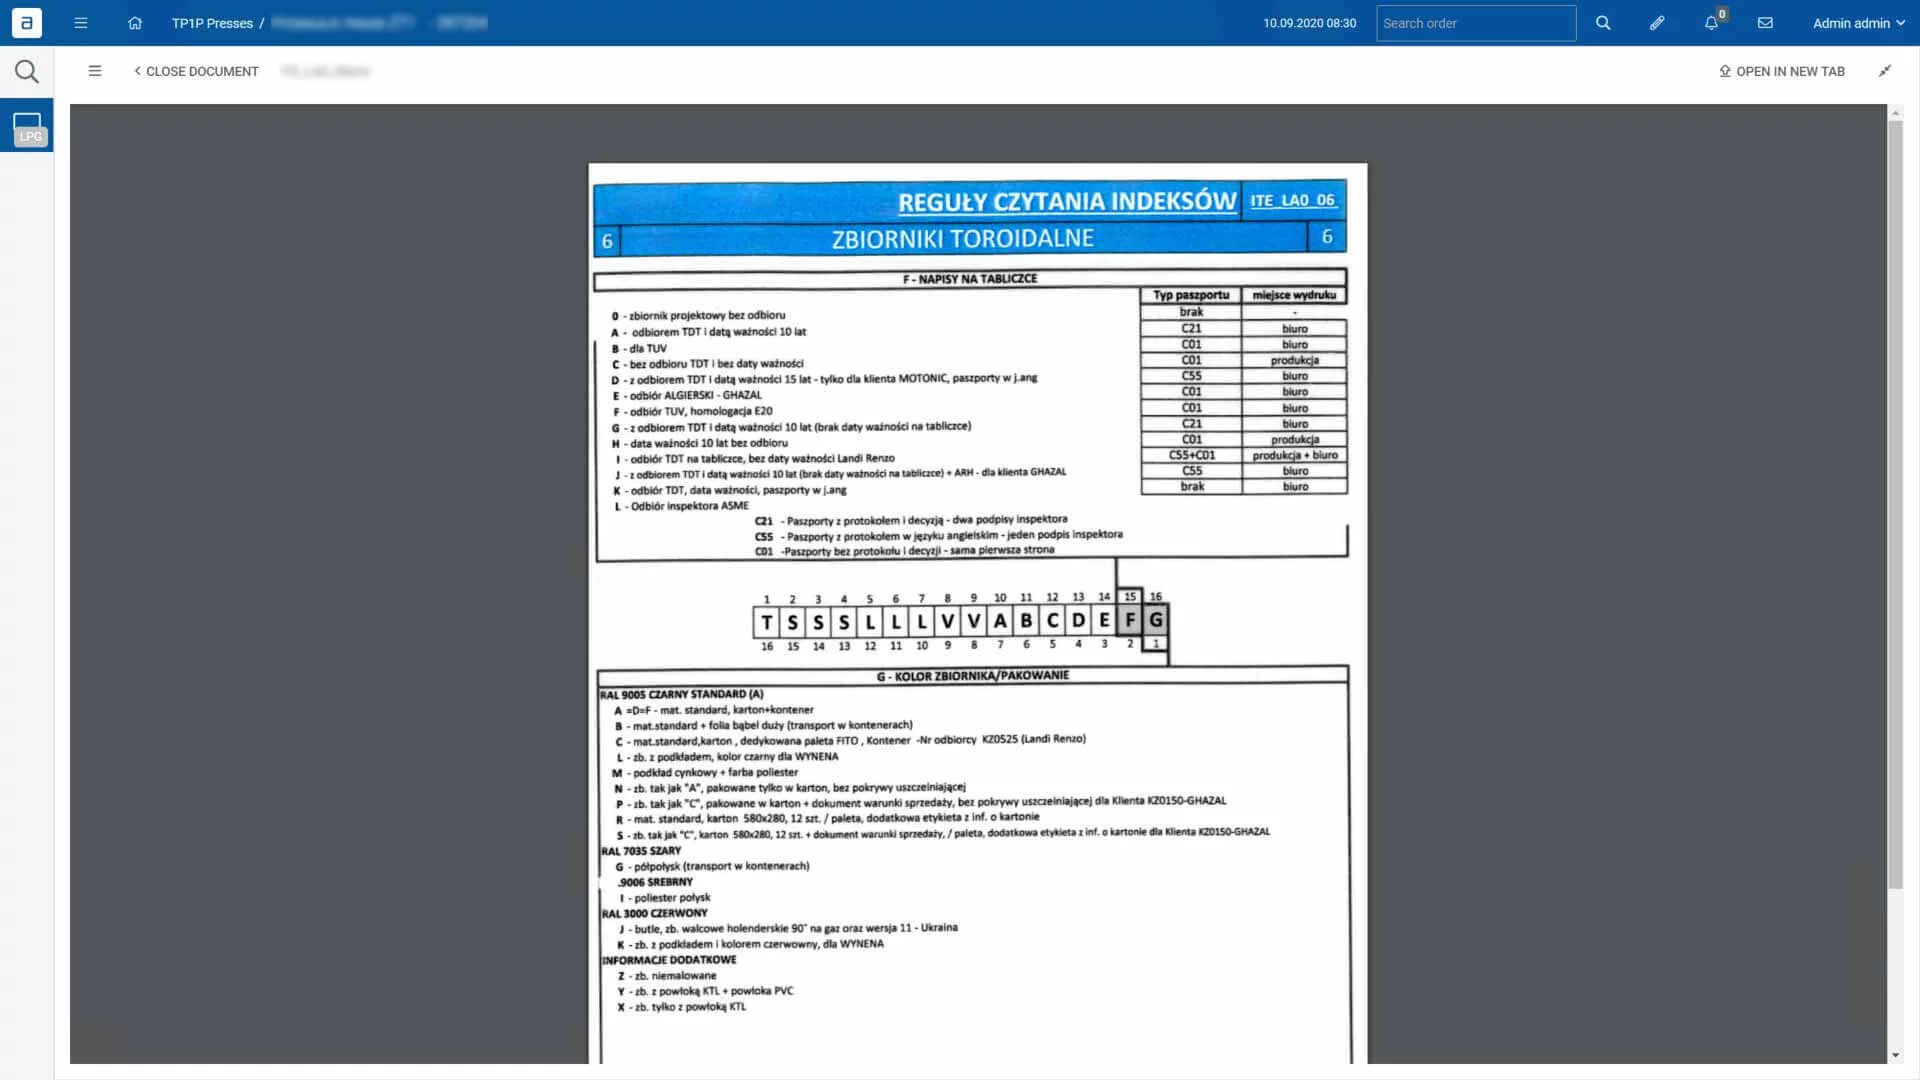
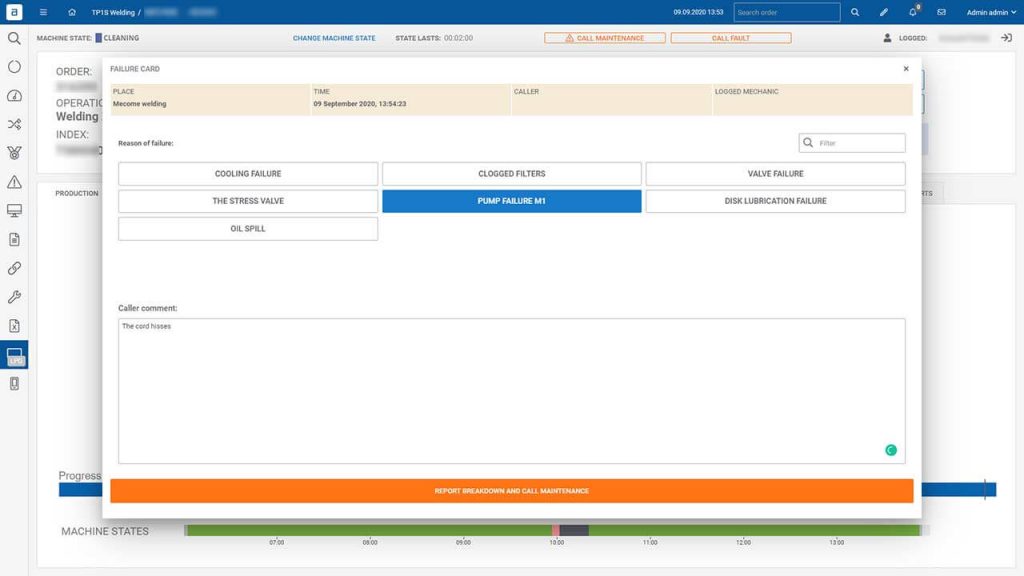
How does MES solution eliminate paper from production and shopfloor?
Digitalization has firmly established itself in everyday production processes, regardless of the industry. Nevertheless, habits remain from the days before widespread digitalization, traditional solutions not