
After the implementation of MES, we usually notice a strange effect. In most cases, after the system go-live, the OEE coefficient is lower than before the installation. Typically, change leads to making things worst at first. Unfortunately, this decrease is not only caused by the work methods change but also by other reasons
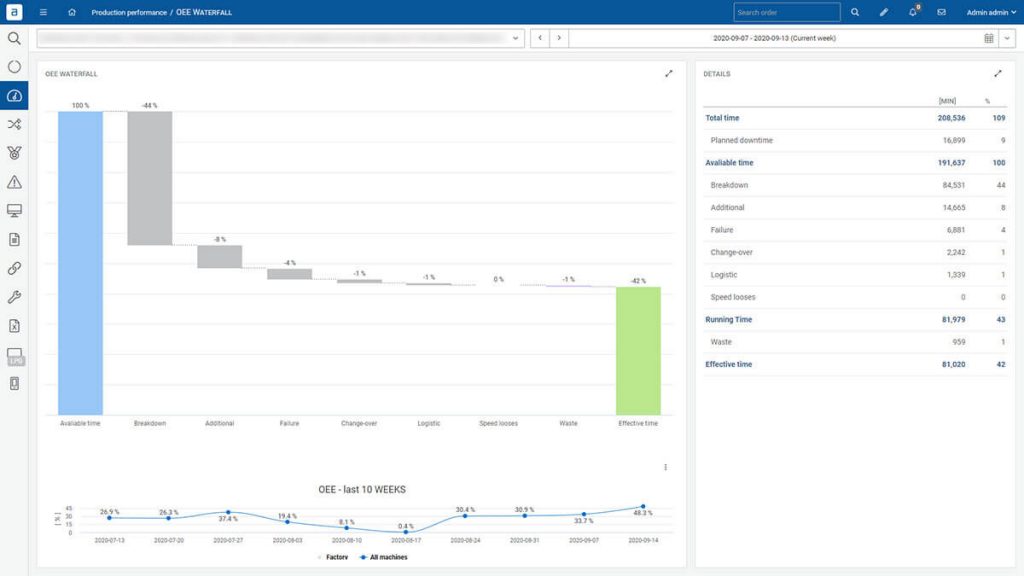
Do you trust your production reports?
We often meet the following situation. An operator completes a paper production report at the end of his shift. In theory, he should do this on a regular basis, but (rightly so!) production is more important. He notes how many parts he has produced, how many defects have occurred that led to reworks and scrap. This is the easy part. Troubles begin when he needs to compare the target with the current state. So: he was supposed to produce 250 units but he produced 190. What happened with the time needed for 60 units? A quick calculation: that was two hours… 15 minutes to start production and 15 minutes to finish a shift, a changeover planned for 30 minutes was prolonged by 30 minutes. That leaves half an hour, which lands under the all-accepting category called “micro stops”. Phew. Done.
The question is: should we then blame the operator for the quality of the production reports? Definitely not! It is not his fault that he doesn’t have the tools to report production effectively and quickly. Do a simple exercise and try to reconstruct minute by minute at the end of the working day. What have you been doing for 8 hours? Do it without looking at your calendar or to-do list?
The main task of the operator is to produce good quality items in the right time. All other activities should be simplified, automated, and minimized. Making decisions based on uncertain production data is like relying on luck. We might hit the root causes, but is that the best way to improve OEE?
Implementing MES is a way to create new standards
In theory, the calculation of OEE seems simple: performance x quality x availability. We have seen the most varied interpretation of these coefficients. The implementation of MES is a great opportunity to revise KPIs and coefficients that tell about the production health. We will eliminate the issue when several factories in the group calculate OEE a little differently, but the results are compared based on one indicator.
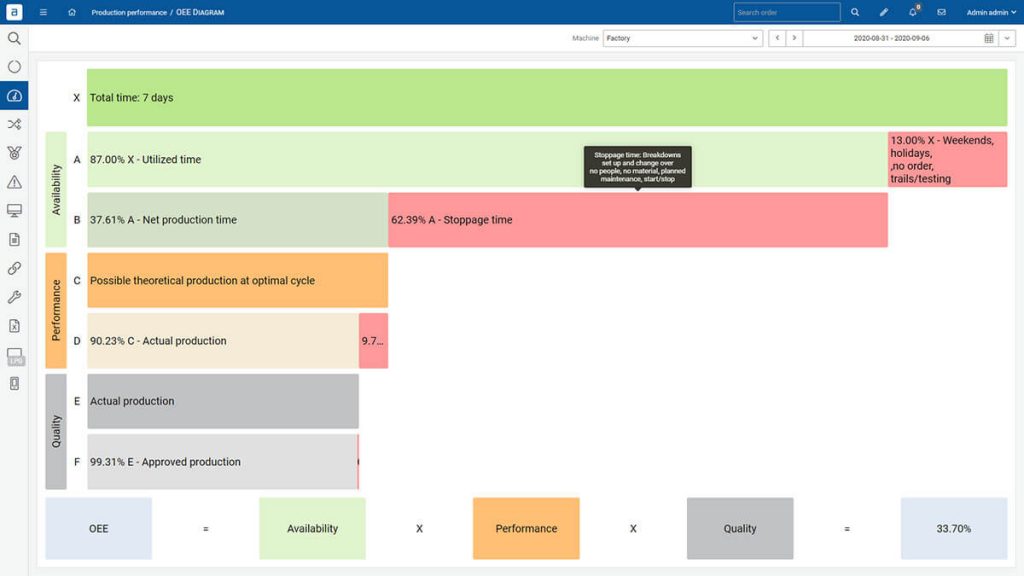
Is there then a single, universal way to calculate OEE for every industry and factory? Unfortunately not… The definitions of coefficients themselves are different, depending on the type of production. For example, in automated manufacturing, a micro stop can be any stop shorter than 30 seconds, semi-automated – 5 minutes.
Here should come an experienced partner that will help to standardize KPIs. At ANT we made more than 600 implementations for various industries. Our task during MES implementation is to propose best practices for your factory in terms of OEE calculation. It is worth proposing such a standard for the whole group in order to compare results as “apples to apples”.
Automated data acquisition will revolutionize your production reports
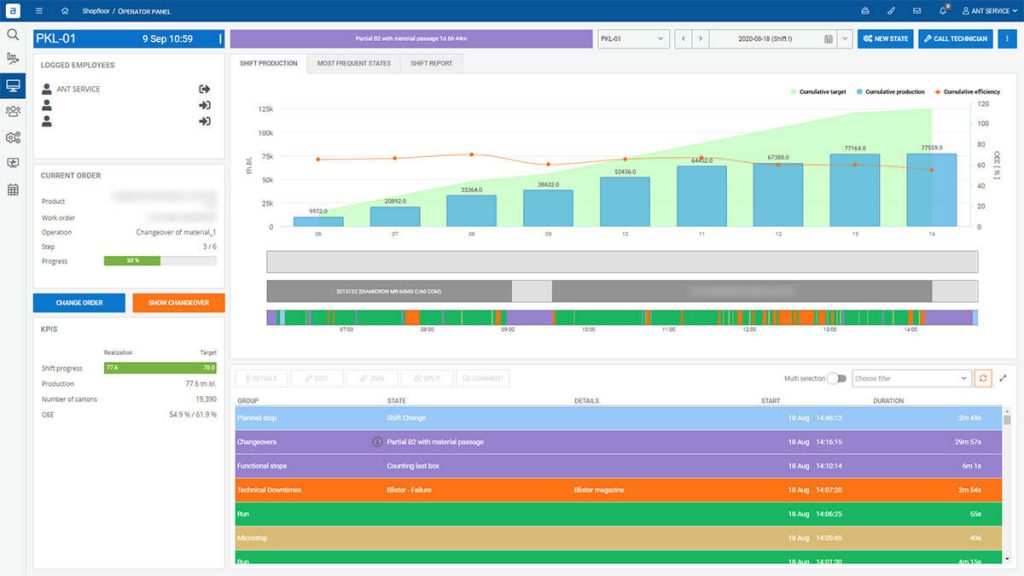
Availability is the time that we spent on production to the time planned for production. One of the biggest benefits of MES implementation is the automation of data acquisition. All states are customized to plant dictionaries and codes. Then, machines can send notifications about downtime automatically or, in the simplest way, system storage for a productive and nonproductive time. In the second case, the operator may be asked to put the reason for stoppages. Whether it does or not won’t affect OEE, but it will allow for more accurate identification of the root causes of drops in availability.
Another thing is the interpretation of the time scheduled for production. It can be adopted in various forms, for instance, in terms of changeovers. Here are 3 most popular approaches:
- We treat all changeover time as a decrease in machine availability and OEE. After all, we could use the set-up time for production.
- We treat planned changeovers time as excluded from the time scheduled for production. Let’s assume that changeover took us 40 minutes instead of the planned 30. In such an interpretation, only 10 minutes will influence OEE decrease.
- We treat the whole changeover as time excluded from the planned production time. Changeovers do not reduce OEE.
ANT Smart Factory allows you to calculate your availability automatically with machine connectivity. Our engineers will create a concept about gathering the data from your machines, whatever you use brand new or legacy equipment.
Better view on defects, reworks and scrap
The task to calculate quality seems trivial on the surface. After all, quality is the number of the number of items that met the quality standards to all manufactured items. But how should we handle reworks?
I will describe the two most common ways how can include reworks to OEE:
- We treat the time needed for rework as unscheduled time. Then rework has no impact on OEE, but will reduce TEEP. This option seems most reasonable in cases where reworks are done in batches after production. OEE was reduced by decreasing the quality factor when the part was first in the production process.
- We treat rework as new raw material that returns to the operation specified in the technology. This approach impacts the OEE. All the coefficients will be calculated a second time. This option seems to be the most reasonable in the case when repairs are made during the current production order. In this case, you should keep a closer view of the reworked parts to avoid a situation of repairing too many times same items. You may consider scrapping items after 2-3 reworks.
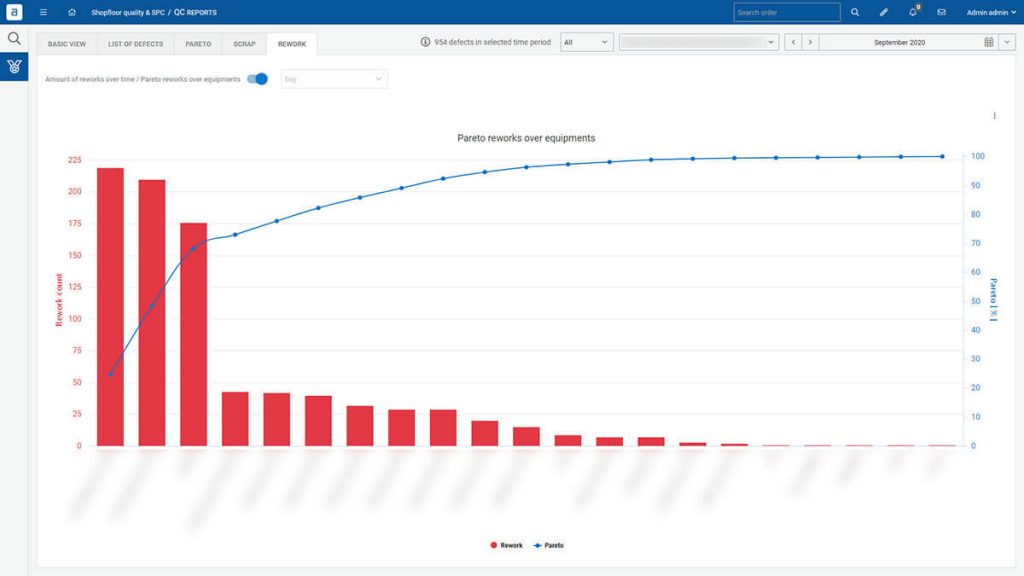
An interesting approach is to have the possibility to put the responsibility for the source of the machine that created the defects. The operation that finds the defect is not always the source of it. Thanks to the ANT Smart Factory system, you can recalculate the factory’s OEE after identifying defects on later production steps.
The right cycle time is a key to getting the real performance value
Performance is the actual cycle time to the ideal cycle time. Micro-stops have a big influence on performance. However, many factories use “standard production speed” as the ideal time. It is a reason for the overstated value of OEE.
To fully understand your OEE and search for improvements, you should use the maximum theoretical production process speed as the ideal cycle time. Any other approach will hide real performance and raise OEE by hiding losses.
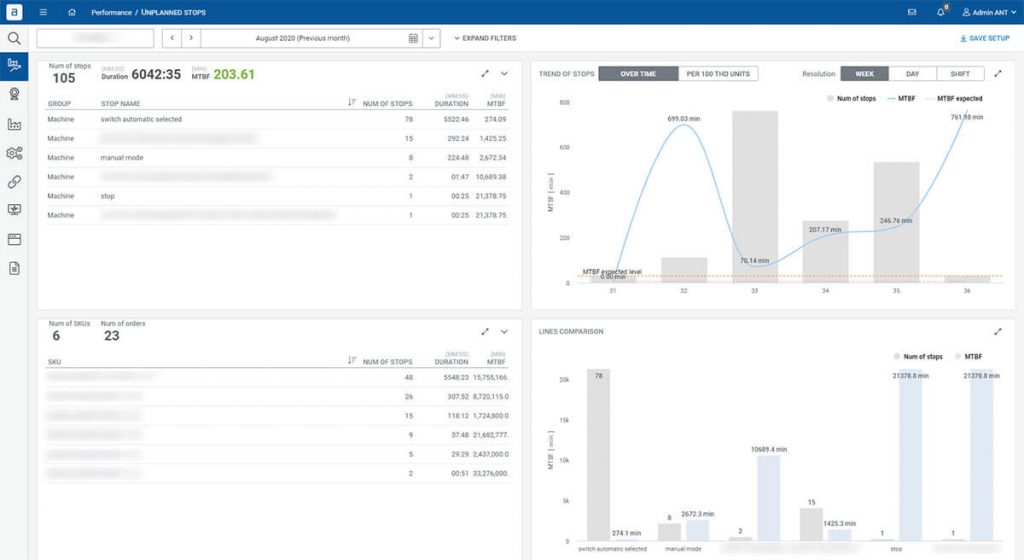
The operator cannot note down every reason for micro-stop. The machine can report automatically its causes by deep communication with the PLC. When a production line consists of many machines, finding the real reason for a line stop is not simple to do it manually. The micro-stop algorithm, developed by ANT, does it automatically and precisely. It is an algorithm that identifies responsible the machine that was the reason for the line stoppage with a proper alert. The operator can fully concentrate on production because the whole reporting process works automatically.
Examples from life
The plant manager goes through the shopfloor and sees that the machine is not working. Operators are bustling and tiding the machine. At the end of the week, the production report is ready. OEE at level 80% and with no production stoppages, especially lack “cleaning the machine” state. The plant manager doesn’t trust this production data and the OEE value. After ANT MES implementation, the OEE will decrease to 60-65%. Finally, the real data to improve processes and increase production volume will be available. ANT engineers will develop the best way to calculate OEE. In this plant machine states, planned and unplanned downtimes won’t be unclear anymore. The revised OEE coefficient will show areas that need to be improved immediately.
The second case is a 4 plants manager who knows, that the group doesn’t have a standard for OEE calculation. Every plant calculates it in its way because “processes are different”. Nothing could be further from the truth, OEE is an indicator that can be standardized for the group and is able to show the real effectiveness of machines. The manager will get the ANT Smart Factory platform, which allows comparing plants to identify first areas for improvement, training, or LEAN actions.
Summary:
The Examples discussed above do not cover all the challenges in defining availability, performance, and quality. It just shows the complexity of the issue. Simply saying, there are 3 main reasons why the OEE value drops after MES implementation:
- Revision and unification the way of OEE calculation. Definitions that were taken for granted are discussed with the MES supplier and updated with trends and best practices for the industry.
- Changing the way of reporting from manual to automatic. Integration with PLCs, duplication of automation signals, or installation of appropriate sensors sends the data about the status of machines in real-time. Cycle times, micro-stops, or production progress are calculated automatically.
- More detailed reporting. Each produced item will be reported, together with each defect, machine state, or rework. Due to no space for guessing, the quality of reports will be unquestioned.
Which option do you prefer? Living in blindness to production issues or real data? Contact us for a free consultation on how to suit the OEE calculation method to your production.


Manufacturing Operations Management System (MOM)
Manufacturing Operations Management System (MOM) The most complete manufacturing solution with full support for operations management and a link between industrial automation and business operations

MES System – Manufacturing Execution System – ANT Solutions
System MES – Manufacturing Execution System 0 % operating time increase 0 % defects quantity reduction 0 % material consumption reduction 0 % changeovers time

OEE Performance monitoring
Performance Monitoring (OEE) Connect and gather data from your machines. Schedule a Demo They Trusted Us: Key Benefits OEEincrease ✔️ shorter downtimes ✔️ faster production