How to increase production transparency?
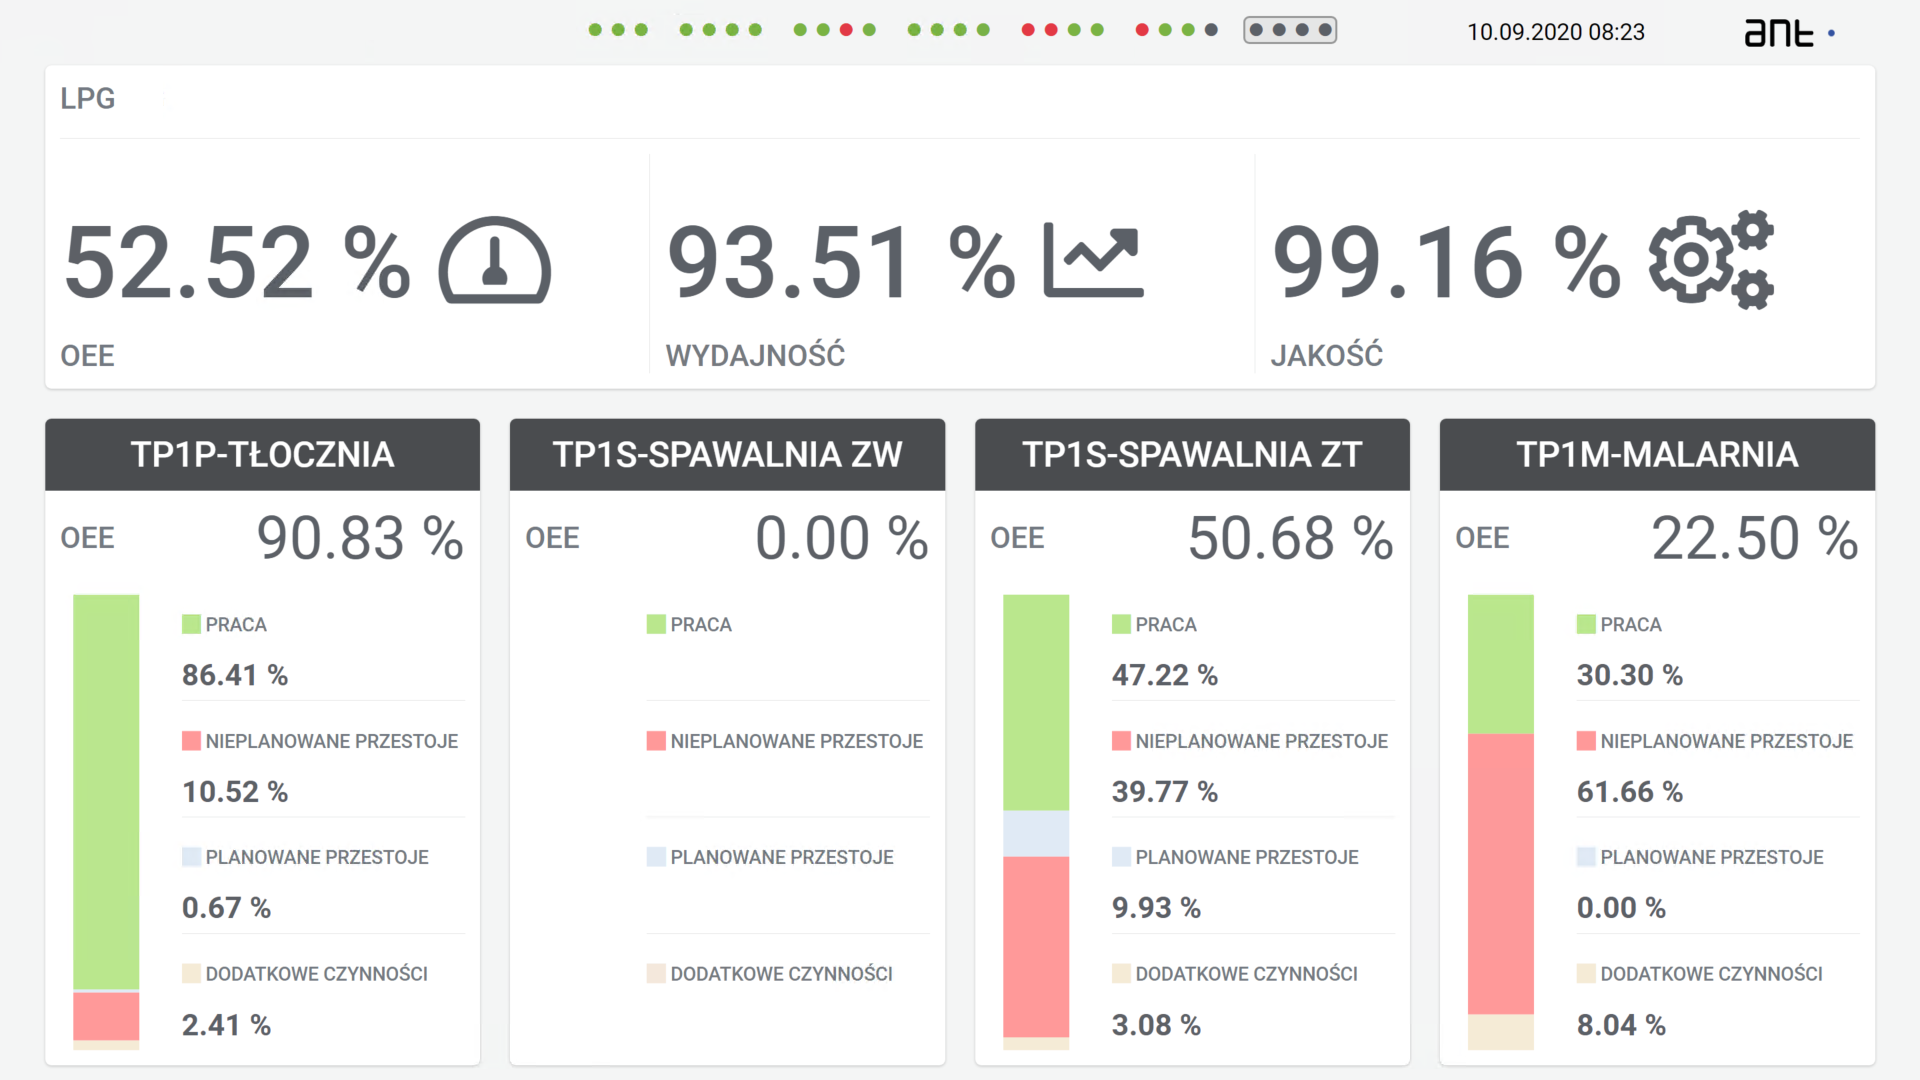
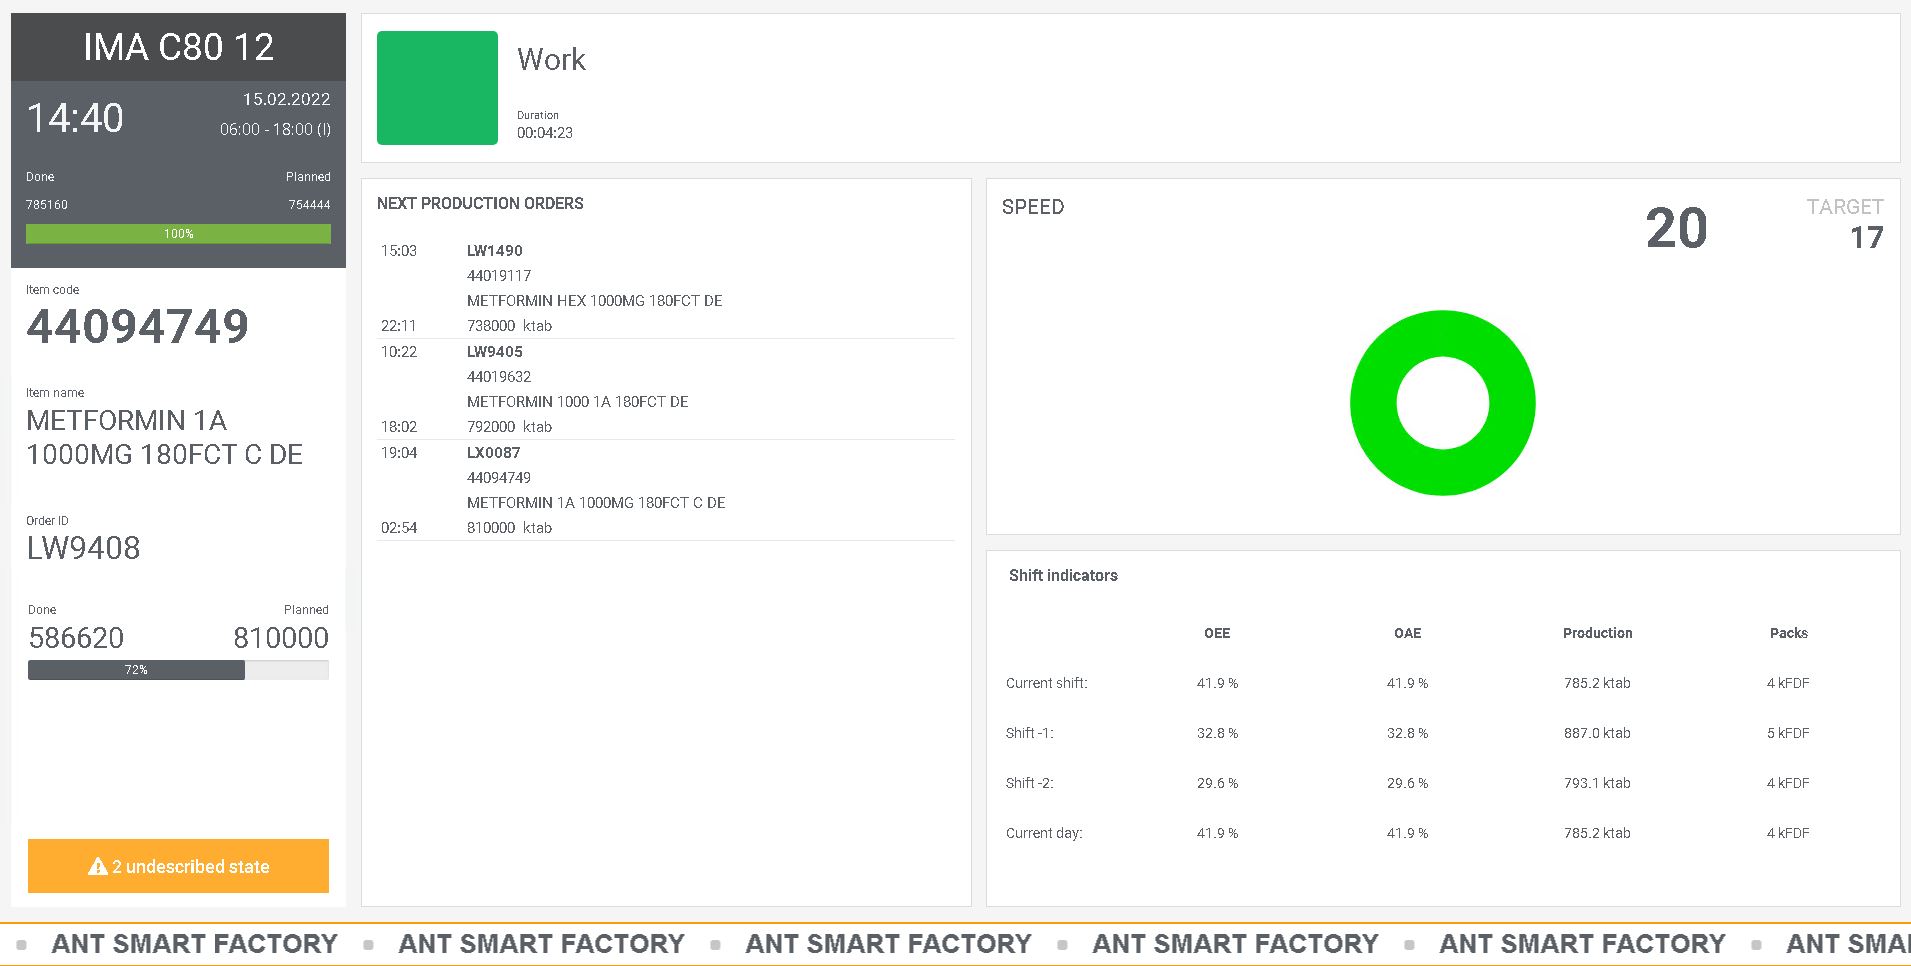
The crucial is gathering the data in real-time and choosing KPIs that will be understandable for everyone on the shop floor. The ANT system has a set of built-in views that will visualize the current health of production: production order progress, shifts target completion, department’s/factory OEE, machine/line state, summary downtimes, and an outstanding number of defects and delays. They can be displayed on the 65″ screens in the factory to improve transparency.
Why the production should be transparent?
Transparency has a big influence on increasing work engagement. Data is not hidden and is available on the shop floor for everyone. Management can make decisions easier and faster based on actual data, and the machine’s work is visible and easy to compare with other lines/shifts. Target / KPIs / results / machine states are visible at glance.
Main features
Display production summary for selected machines
Display current shift’s OEE and production delay
Real-time data update based on reports or machine’s cycles
Key benefits
Better production transparency for operators and managers
Faster reaction times based on data from TV
Clear visibility with production progress and issues

Related articles

How to increase production transparency on the factory shopfloor?
Transparency in manufacturing may sound like a marketing ploy, but it actually brings tangible benefits, from smoother workflows to significant financial savings. If transparency in

How to guide operator on shop floor – step by step production and changeovers
Operator guidance is an essential part of the production process. It primarily ensures that the process is executed following the developed technological guidelines. Step-by-step support

