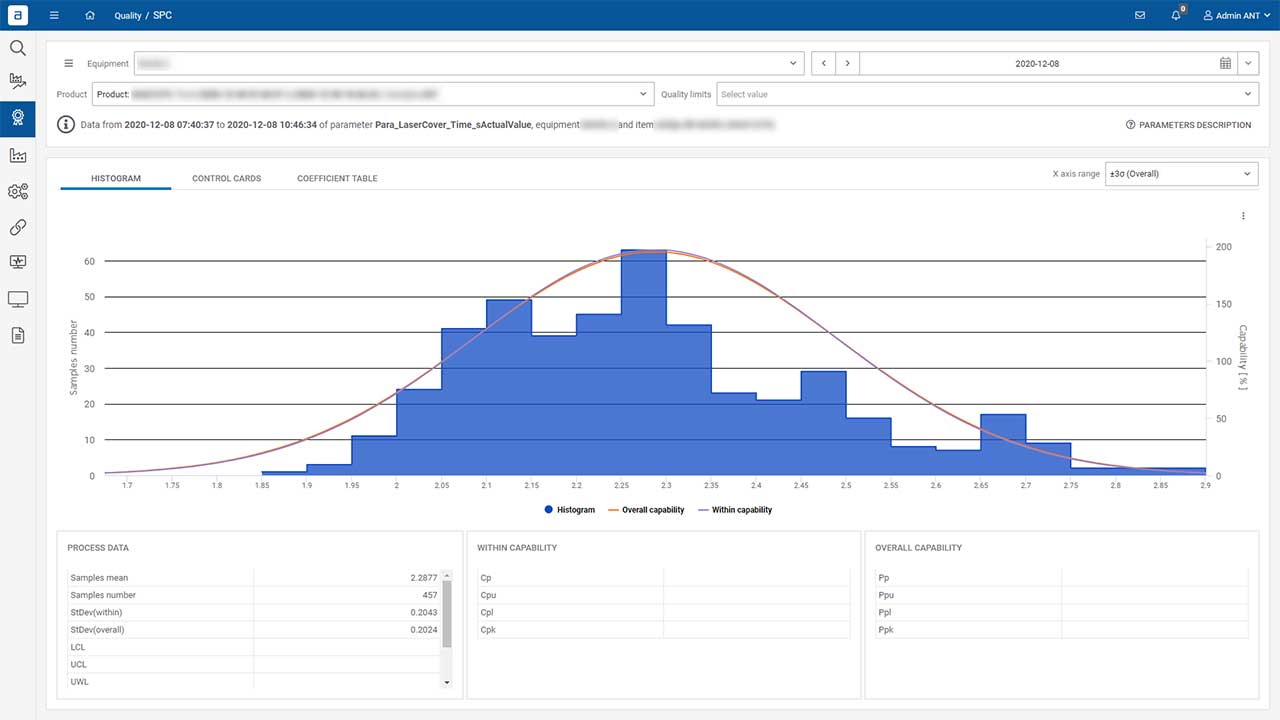
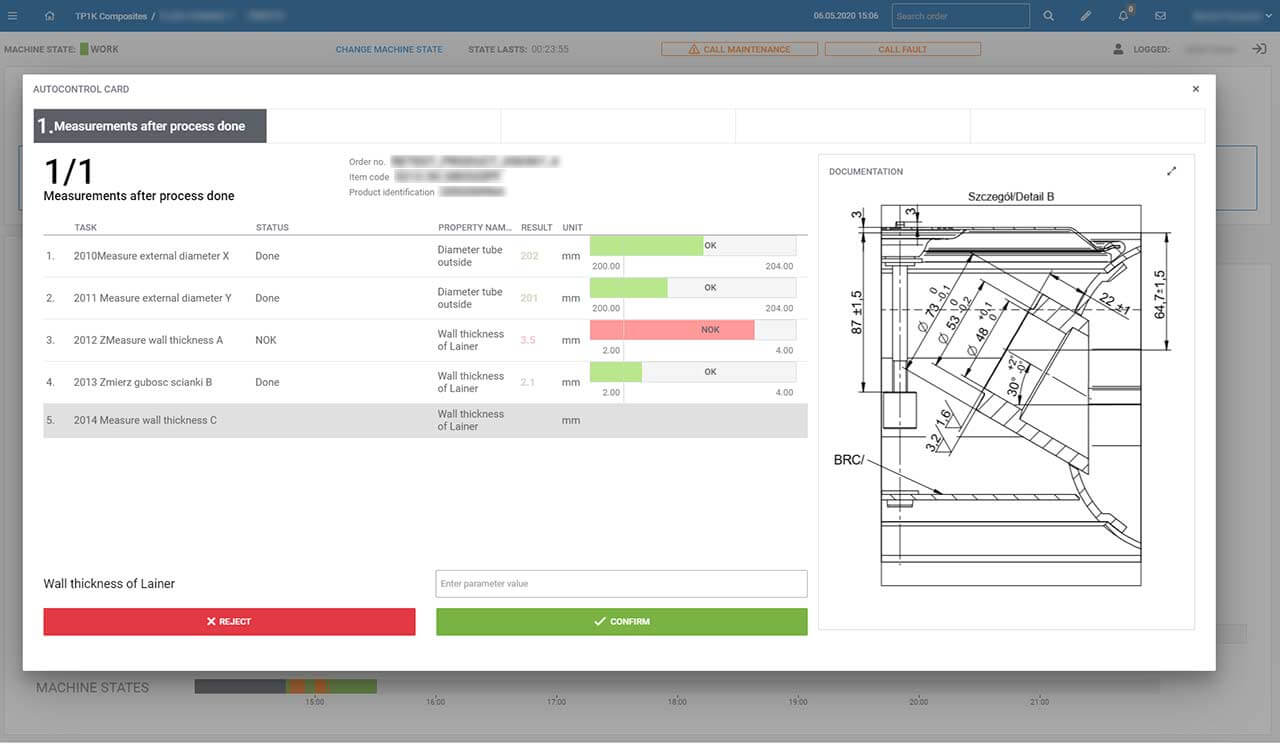
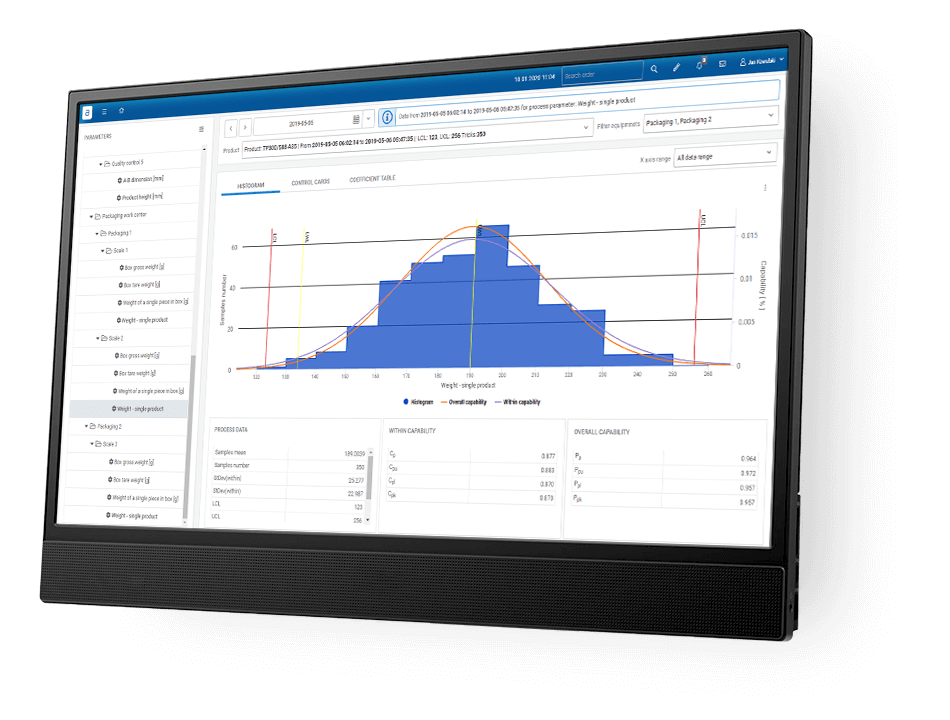
Quality Inspections are automatic way for periodic quality tests with immediate confirmation if measurement is within quality limits. Measurements are being read from automation level or are provided manually by operator. Thanks to SPC report and Shewhart control charts the stability of production is being monitored.

Key functions
- Shop floor Inspections
- Material Parameters Checks
- Advanced Defects Reporting
- Product Acceptance
- Quality Checks Notifications
- Quality Plans
- SPC
- Sample Testing
- Reworks
- Advanced Quality Reports
Key benefits

Less defects thanks to quality plan done on time and quality divergences identification

Certainty that the production quality is checked according to standards in factory

Early recognition of unstable process and faster reaction to quality results

Quality Inspections - How system can support your operator in keeping quality under control?
- The system supports quality control processes
- The system displays actions needed to be done based on quality plan configured as activity (list to-do)
- The system is able to provide instructions for quality inspections based on different sampling routines e.g. starting operation, every “N”, or similar
- The system lets user to confirm that the user has gotten familiar with newest quality complaint documentation
- The system shall present to user test status after comparison the inserted measurement value with quality limits (condition based process parameters monitoring)
- The system graphically presents how far the inserted measurement value is from the target, mix and max quality limits
- The system presents Shewhart control charts for ongoing production
- System supports real-time notifications
- The system has the option of generating alarms via email or SMS when the inserted quality measurement value is out of the limits
Quality Reports -
What can you document?
- Operate on SPC with Gauss and Histogram charts
- Get informed by analysing Shewhart control charts
- Rejects history: defects, scrap, rework
- Quality tests history: how many in limit and out of the limit
- Process parameters history: graphical chart with measurements

Related articles

How to gather data for SPC report – automatic and manual measurements?
SPC, or statistical process control, is one of the most interesting tools in the context of quality management. Nowadays, this method is widely used

How to get automatically reports from production
Digitalization means that reporting in its traditional form, as we have known it for years – in paper form, symbolically passed from hand to hand

How to avoid production errors: labelling, validation, and quality gates on production
Achieving high-quality indicators is an essential aspect of ensuring customer satisfaction and promoting further company growth. For this reason, modern production facilities implement further functionalities

