
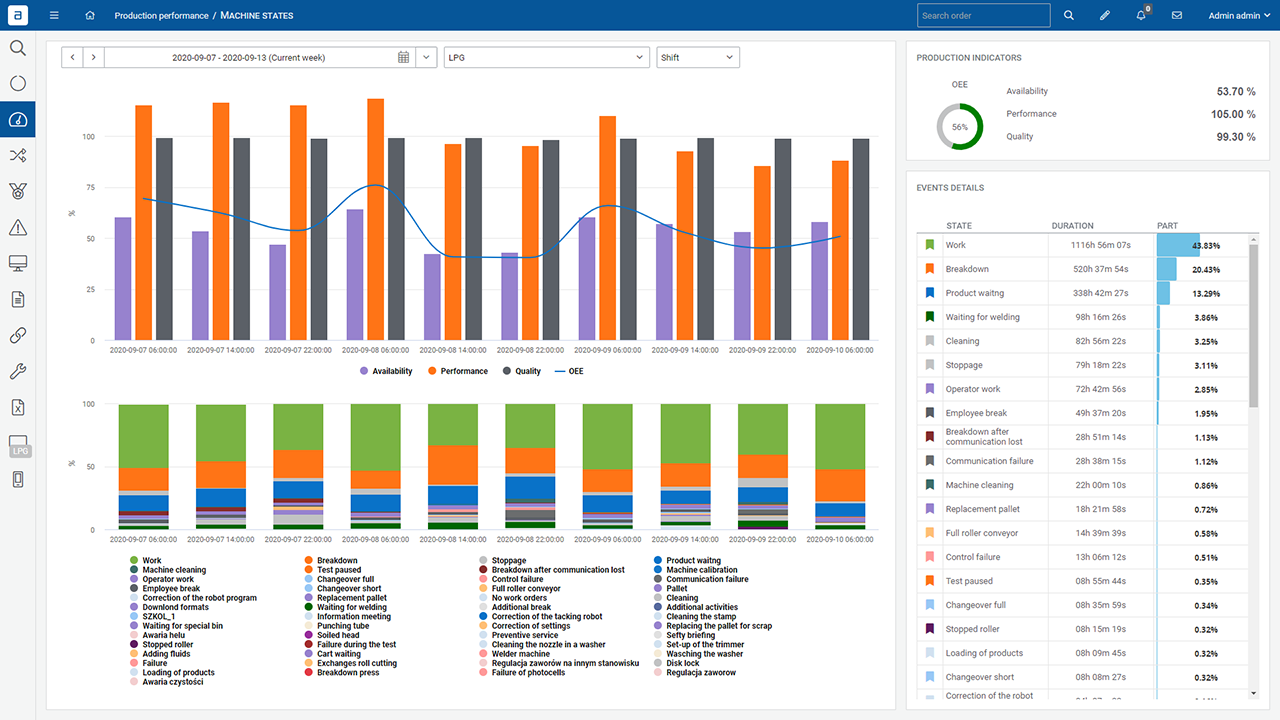
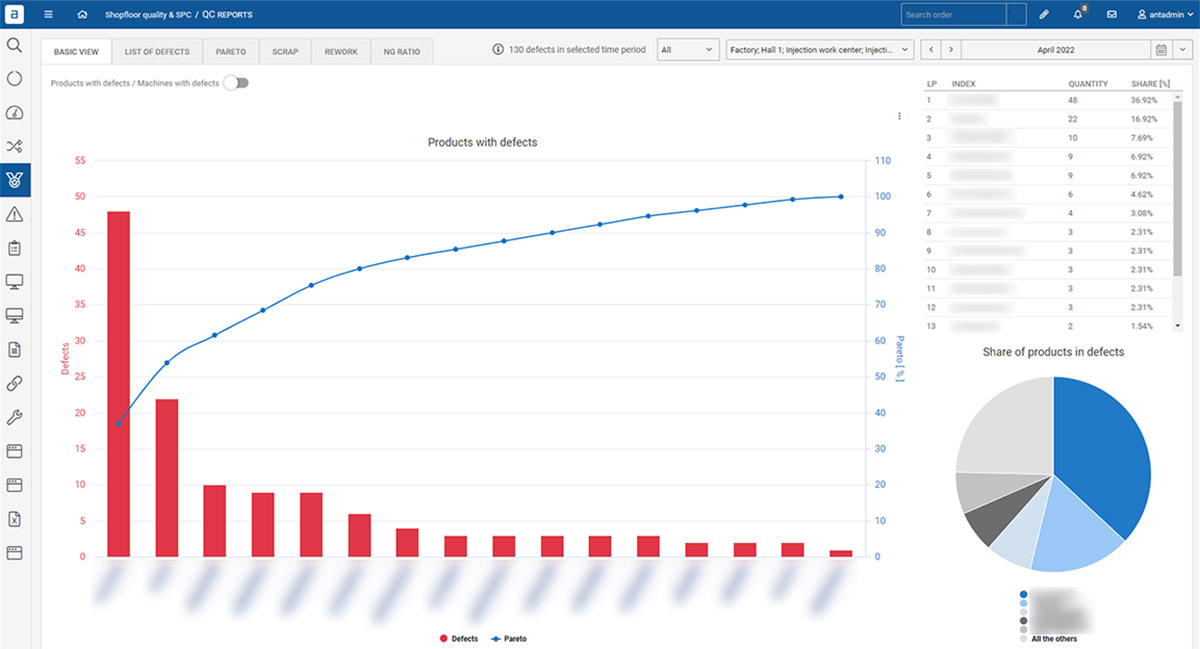

Rapporti vari per la produzione, le macchine, la qualità

Dashboard per la produzione in corso

Un'angolazione diversa per l'analisi dei dati

Generazione automatica e rapida di rapporti

Accesso rapido a dati aggregati e dettagliati

Esportazione dei dati in Excel per la creazione di report personalizzati
Blog
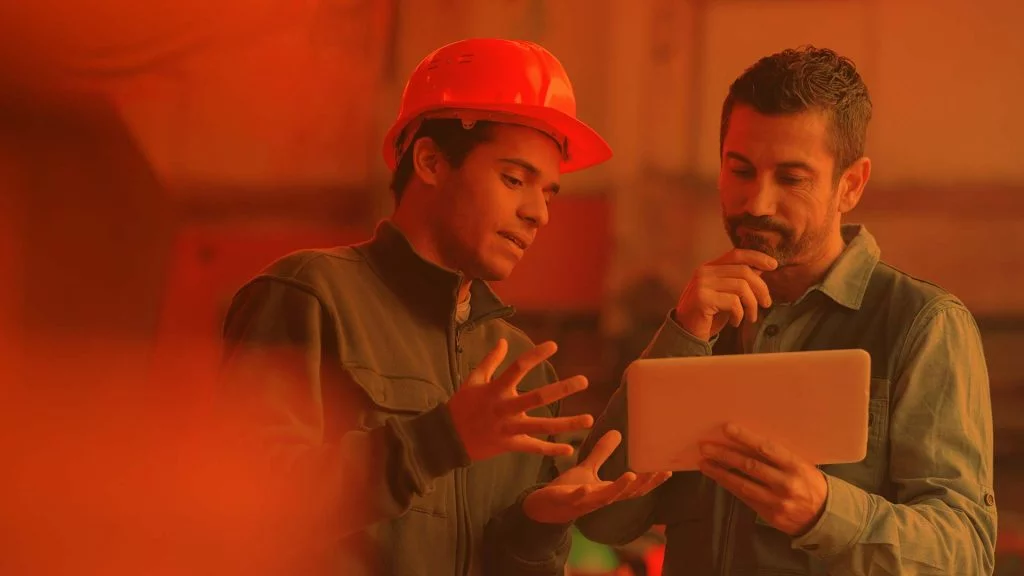
Come rendere più efficienti le riunioni in fabbrica?
Le riunioni in officina sono praticamente quotidiane e sono essenziali per far funzionare le cose in modo efficiente ed efficace. Il tipo e la quantità di
Blog
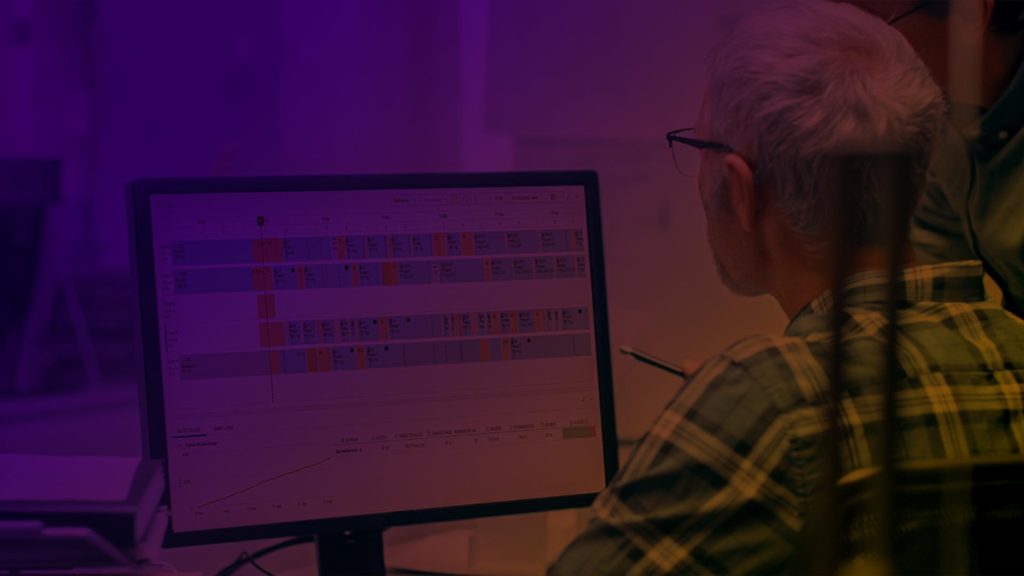
Come monitorare efficacemente l'andamento della produzione in tempo reale?
Il monitoraggio dei cambiamenti nella produzione - avanzamento, tempi di consegna, possibili fonti di ritardo - svolge un ruolo particolarmente importante nell'industria. Consegnare i prodotti
Blog
Come monitorare e controllare una linea di produzione di assemblaggio automatizzata?
Con l'avvento dell'Industria 4.0, l'automazione in senso lato delle linee di produzione è diventata uno standard, senza il quale è difficile immaginare un moderno sistema di produzione.

