
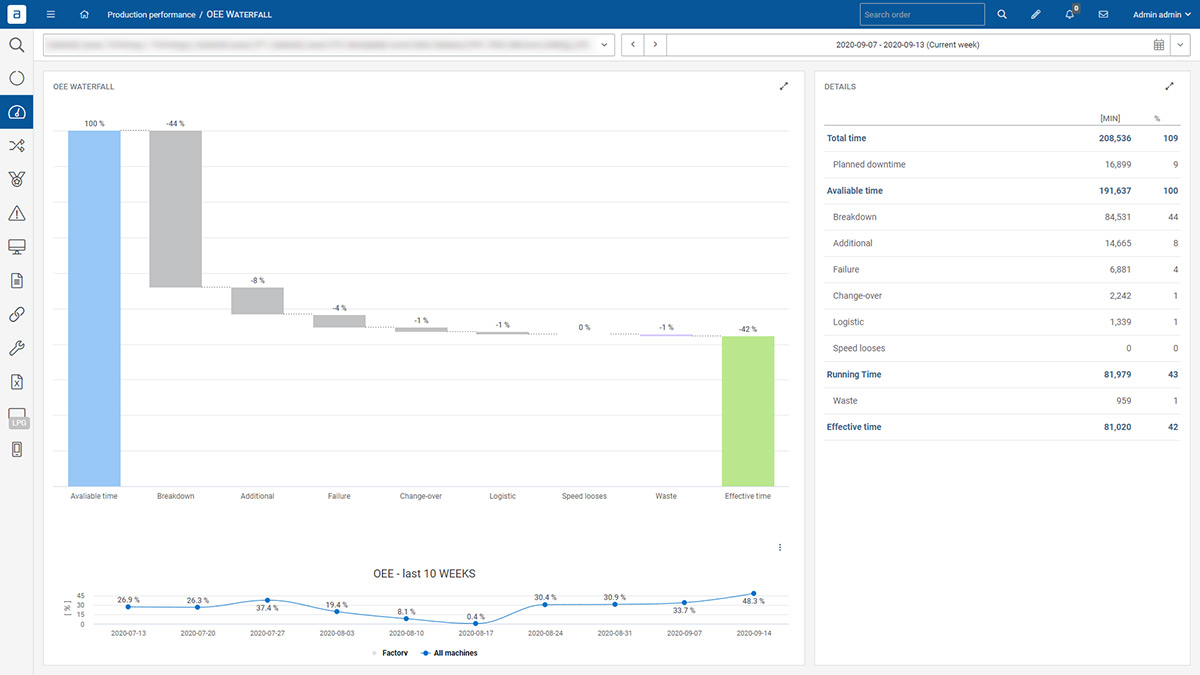
The OEE is the result of three factors, these being availability, performance, and quality. It’s no secret that improving just one of the factors immediately increases the value of the OEE and therefore brings about benefits for the business in its entirety. In the manufacturing sector achieving optimum results across all three areas is key to operating a successful line since they all individually contribute to the viability of the product or service and the profitability.
Dostępność - sprawia, że Twój czas naprawdę się liczy
This factor essentially encompasses any events that have the potential to bring any planned production to a halt for a sustained time. Though downtime is a necessity in the manufacturing industry, it should be kept to a minimum to minimize losses and ensure maximum productivity. There are three main ways that this can impact the overall OEE.
1. Zbyt wiele nieplanowanych przestojów
This is often due to reactive maintenance. However, failing to gather information about the real reasons for downtime can also prevent improvements from being made in this regard.
2. Downtime that drags on for a sustained period
Powolny czas reakcji służb utrzymania ruchu, ręczne wywoływanie przeglądów, brak gromadzenia historii eksploatacji maszyn lub brak aktualnych informacji to jedne z głównych przyczyn takiego stanu rzeczy.
3. Brak pomiaru i poprawy KPI
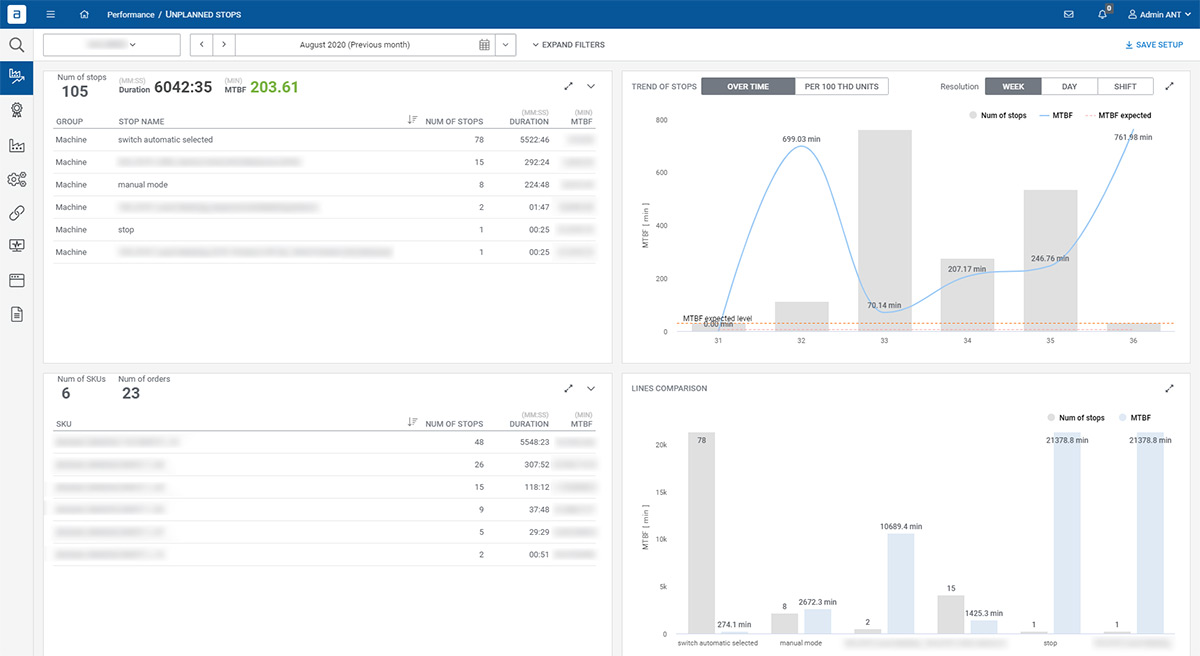
MTTR (mean time to recovery), MTBF (mean time between failure), and MTTF (mean time to failure) all have a part to play in both measuring and improving key performance indicators.
ANT’s endorsed approach to availability is the Andon maintenance module. The Andon maintenance module seeks to reduce such issues by compiling the history of repair reports and using the most recent failures as hints, measuring maintenance reaction times, providing relevant maintenance services along with the causes of downtime, and taking KPI measurements (MMTR, MTBF, MTTF) regularly.
Wydajność - umiejętność dostrzegania wszelkich potencjalnych nierówności na drodze
The performance takes into account anything that causes the manufacturing process to run at less than the maximum possible speed when it is running (including both Slow Cycles and Small Stops).
However, it’s important to highlight that this particular factor is not associated with units produced, but rather with the equipment or technology used to run the manufacturing line itself. Here, adjustments can be made to boost the efficiency and capability of the line in question.
4. Cykl powolny
Jest to na ogół związane z brakiem monitorowania pod kątem rzeczywistych czasów cyklu, brakiem automatyzacji, brakiem planowania zadań lub zbyt dużą liczbą mikroprzestojów w danej perspektywie czasowej.
5. Długie uruchamianie produkcji
Multiple changeovers are among the most common culprits in these cases, although manual communication with laboratories or quality control departments can also impact production launches.
6. Brak szkolenia operatorów
Może to być spowodowane brakiem cyfrowych instrukcji krok po kroku dla operatorów, zbyt długim czasem wprowadzania na rynek lub brakiem przejrzystości w zakresie produkcji i celów produkcyjnych.
To combat these three reasons for limited performance, ANT has created Digital Documentation and Paperless modules. These enable you and your manufacturing team to display digital information to the operators, categorize documentation such as changeovers and quality controls, guide operators through production and changeovers using step-by-step activities, and automate communication with the laboratory.
It is hoped that this tool will enable you to make your line more efficient and, as a result, boost your overall productivity. Although it may seem cliché, it’s often true that the key is in the finer details, and although a micro stop may seem insignificant, a micro stop module is designed to open your eyes to their potential impact.
Jakość - kontrola szczegółów z bliska i osobiście
Z kolei jakość uwzględnia wyprodukowane części, które nie spełniają standardów jakości, w tym części wymagające ponownej obróbki. Innymi słowy, jest to sposób pomiaru wydajności procesu w linii oraz tego, jak wpływają na nią defekty lub modyfikacje.
7. Zbyt wiele wad
A lack of analysis in defect production stands out as the most common cause, although cyclic activity lists for operators can also influence the number of defects detected.
8. Brak walidacji stosowanych materiałów/narzędzi/parametrów procesu przed uruchomieniem produkcji
Cross-checks with used materials batches in the ERP system used material codes in BOM lists are essential in this case, however, it is also crucial to ensure that the machine setpoints (recipes) are correct (manually by the Operator or automatically by ANT system & PLC)
9. Późne rozpoznanie niestabilnego procesu
This is commonly associated with a Lack of SPC diagrams & control charts & condition-based monitoring. That said, failure to implement automatic counting of how many cycles the tool has made (tool life cycle monitoring and regeneration plan) can also influence late recognition.
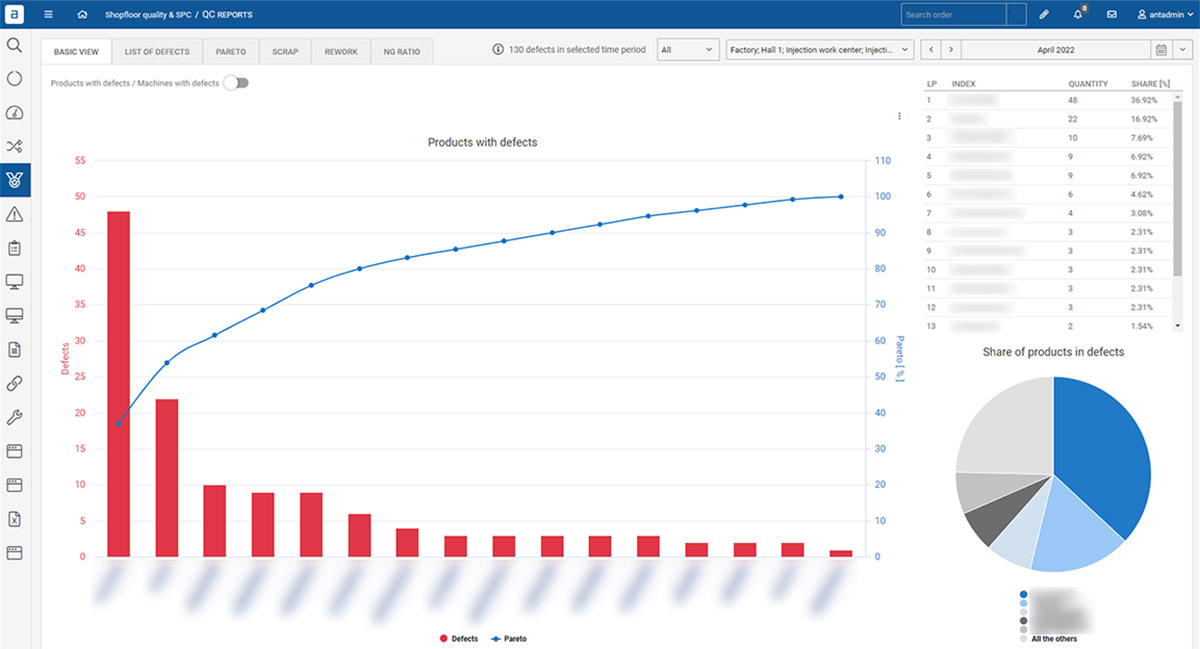
ANT seeks to remedy these issues through the launch of its Quality Inspections module, which helps operators and other line management staff to make more informed decisions, by providing them with automated feedback and detailed instructions. The module is also capable of producing a series of quality reports covering specific aspects such as defects.
Ogólne przyczyny wpływające na OEE
10. Równanie OEE
It’s worth bearing in mind that the use of manual calculation methods is often inefficient, many companies also tackle the OEE calculation rather unobjectively or simply fail to implement it altogether
11. No tools and no plan for what to improve
A lack of tools to compare shifts, operators, machines, lines, and items, no clear method that determines how the gathered data should be used, or a lack of trend analysis also leads to issues in terms of production efficiency.
12. Niewiarygodne dane
Jest to kolejny wróg efektywności produkcji często spowodowany naleganiem na stosowanie dokumentacji papierowej, opóźnieniami w przekazywaniu informacji oraz maszynowym gromadzeniem danych w czasie rzeczywistym.
Of course, not all the reasons for low OEE can be attributed to these three main factors. However, our real-time notifications can help to minimize the impact of any issues that you may experience. Our system is also customizable so you can calculate your OEE in a way that works for your business, as opposed to using a standard, one-size-fits-all program.
The real value of OEE can’t be underestimated in manufacturing processes and improving quality, availability, and performance is essential, as difficult as it may seem. The way forward is to make decisions based on numbers instead of personal opinions.
Jeśli potrzebujesz dalszej pomocy w zakresie pomiaru i poprawy OEE firmy, a następnie nie wahaj się skontaktować się z zespołem w ANT o profesjonalną pomoc i doradztwo. Jesteśmy szczęśliwi, aby omówić, które moduły są najlepiej dostosowane do konkretnych potrzeb i wymagań.

Monitorowanie wydajności OEE
Monitorowanie wydajności (OEE) Podłącz i zbieraj dane z maszyn. Zaplanuj demonstrację. Kluczowe korzyści Wzrost OEE ✔️ krótsze przestoje ✔️ szybsza produkcja

Monitorowanie mikroprzestojów
Monitorowanie mikroprzestojów Najskuteczniejszy system dla branży FMCG do monitorowania tempa produkcji i przestojów Zaplanuj prezentację Co to są mikroprzestoje i dlaczego są tak popularne?

System MES - system realizacji produkcji - ANT Solutions
System MES - Manufacturing Execution System 0 % wydłużenie czasu pracy 0 % redukcja ilości defektów 0 % redukcja zużycia materiałów 0 % czas przezbrojenia