


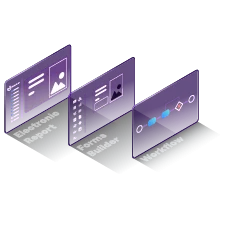
Machine
Connectivity
We collect signals from every possible machine on the market
Software
Development
You get an out-of-the-box modular system ready for major customization
Implementation
We provide the infrastructure and do all the heavy lifting
Continuous
Support
You get 24h/7 on demand support


How to manage reworks in production?
Let’s be honest – the term “rework” is most commonly associated with delays in production. Technically speaking, rework means correcting failed, defective, non-conforming items. It

Generative AI in Manufacturing: First Steps in embracing AI in your factory
Generative AI and online chat assistant have become a new buzz words. Use AI OpenAI Assistants and OpenWidget to give your employees helpful assistant to
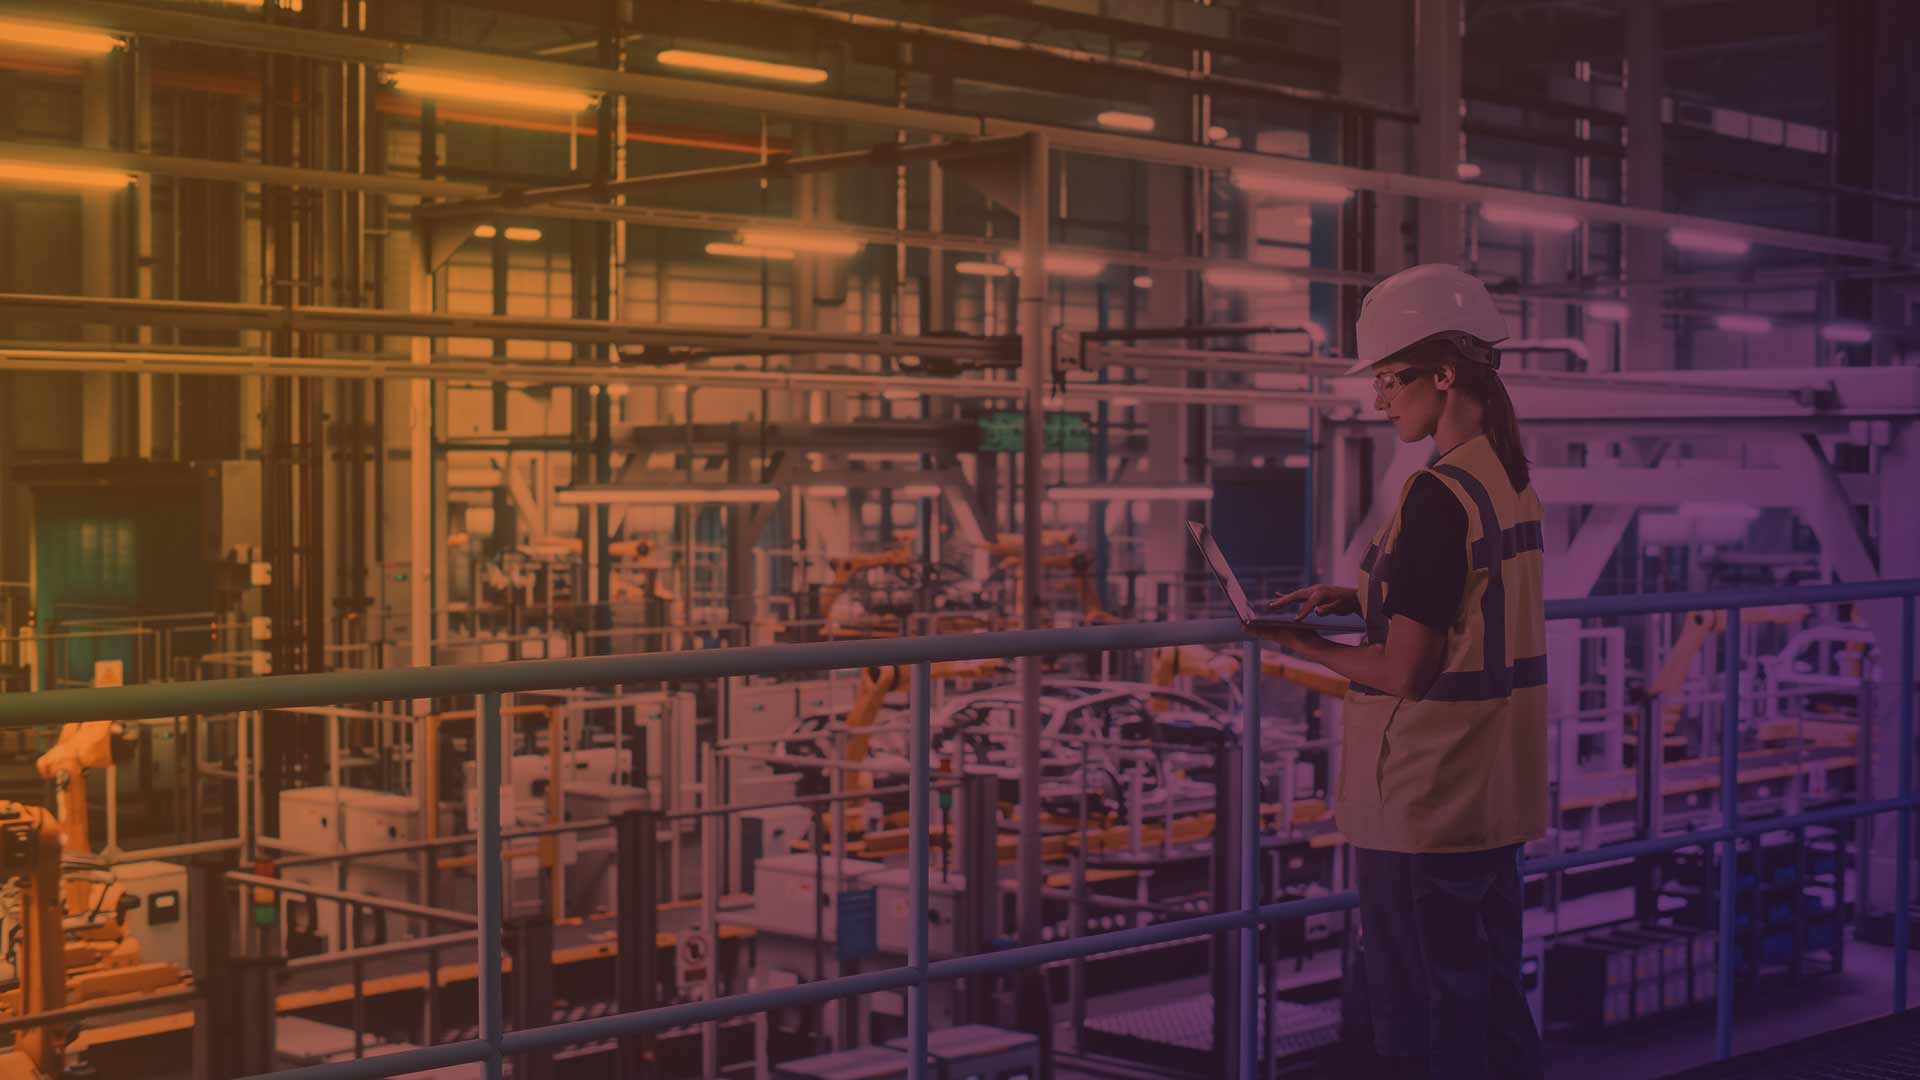
Manufacturing Data Collection – Connect Machines with Modern Production Software
In the evolving landscape of manufacturing, the integration of machine connectivity and modern production software stands as a cornerstone. It marks the confluence of real-time

New Data Act Proposed by EU. Revolution in Data Accessibility in Manufacturing Industry
The European Commission has proposed new rules on who can use and access data generated in the EU across all economic sectors, including manufacturing industry.

Why choose a single partner providing technology solutions for factories?
Implementing modern technological solutions in a factory involves carrying out numerous operations that determine the effectiveness of the finished software. The installation of equipment, implementation

Industry 4.0 challenges – Cloud or On-Premises?
In today’s world, many companies are stuck between whether to stay on-premises or go hybrid. The latter is almost always more difficult, but almost always